SOURCE: National Science Foundation, National Center for Science and Engineering Statistics, Survey of Graduate Students and Postdoctorates in Science and Engineering, 2017.
by Caren A. Arbeit, Christopher Davies, and Michael Yamaner [1]
Graduate enrollment by degree level and field of study are available for the first time through the 2017 Survey of Graduate Students and Postdoctorates in Science and Engineering (GSS), which allows for the monitoring of both master's and doctoral enrollment trends for science, engineering, and health (SEH) fields to assess the potential future stock of SEH personnel. These new data show notable differences in the composition and financial support of master's and doctoral students in SEH fields of study. The survey is sponsored by the National Center for Science and Engineering Statistics (NCSES) within the National Science Foundation (NSF) and by the National Institutes of Health (NIH).
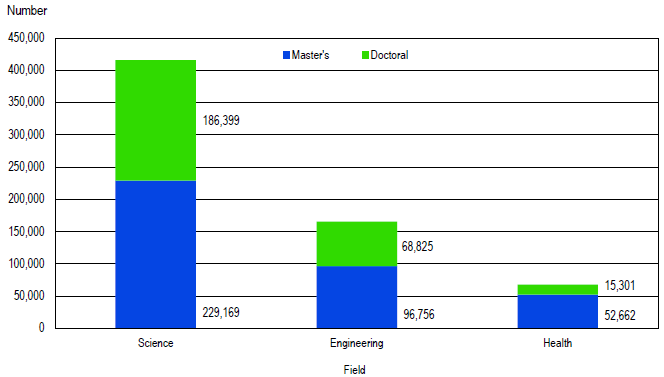
In total, 649,112 graduate students were enrolled in SEH programs in 2017, with 58% pursuing master's degrees and 42% pursuing doctoral degrees. More graduate students were enrolled in science (415,568) than in engineering (165,581) and health (67,963) combined. Over three-quarters (77%) of graduate students in health fields were enrolled in master's programs, compared with 55% of those in science fields and 58% of those in engineering fields (table 1 and figure 1).
| Broad fields | Master's | Doctoral | |||||||||
|---|---|---|---|---|---|---|---|---|---|---|---|
| Total | All | Percent of total |
Percent full time |
Percent part time |
All | Percent of total |
Percent full time |
Percent part time |
|||
SOURCE: National Science Foundation, National Center for Science and Engineering Statistics, Survey of Graduate Students and Postdoctorates in Science and Engineering, 2017. |
|||||||||||
| All surveyed fields | 649,112 | 378,587 | 58.3 | 64.7 | 35.3 | 270,525 | 41.7 | 87.2 | 12.8 | ||
| Science and engineering | 581,149 | 325,925 | 56.1 | 64.2 | 35.8 | 255,224 | 43.9 | 88.0 | 12.0 | ||
| Science | 415,568 | 229,169 | 55.1 | 63.6 | 36.4 | 186,399 | 44.9 | 88.6 | 11.4 | ||
| Agricultural sciences | 9,347 | 5,603 | 59.9 | 64.4 | 35.6 | 3,744 | 40.1 | 84.3 | 15.7 | ||
| Biological and biomedical sciences | 85,217 | 33,926 | 39.8 | 70.4 | 29.6 | 51,291 | 60.2 | 93.5 | 6.5 | ||
| Computer and information sciences | 89,909 | 75,618 | 84.1 | 58.6 | 41.4 | 14,291 | 15.9 | 83.2 | 16.8 | ||
| Geosciences, atmospheric sciences, and ocean sciences | 12,545 | 6,006 | 47.9 | 68.4 | 31.6 | 6,539 | 52.1 | 88.7 | 11.3 | ||
| Mathematics and statistics | 29,669 | 16,568 | 55.8 | 69.7 | 30.3 | 13,101 | 44.2 | 90.9 | 9.1 | ||
| Multidisciplinary and interdisciplinary studies | 9,854 | 6,923 | 70.3 | 58.3 | 41.7 | 2,931 | 29.7 | 79.2 | 20.8 | ||
| Natural resources and conservation | 10,879 | 7,311 | 67.2 | 66.6 | 33.4 | 3,568 | 32.8 | 79.3 | 20.7 | ||
| Physical sciences | 41,829 | 6,368 | 15.2 | 65.9 | 34.1 | 35,461 | 84.8 | 92.9 | 7.1 | ||
| Psychology | 50,033 | 29,638 | 59.2 | 65.2 | 34.8 | 20,395 | 40.8 | 81.5 | 18.5 | ||
| Social sciences | 76,286 | 41,208 | 54.0 | 62.6 | 37.4 | 35,078 | 46.0 | 84.6 | 15.4 | ||
| Engineering | 165,581 | 96,756 | 58.4 | 65.7 | 34.3 | 68,825 | 41.6 | 86.6 | 13.4 | ||
| Aerospace, aeronautical, and astronautical engineering | 5,708 | 3,322 | 58.2 | 65.7 | 34.3 | 2,386 | 41.8 | 87.1 | 12.9 | ||
| Bioengineering and biomedical engineering | 10,882 | 4,037 | 37.1 | 80.1 | 19.9 | 6,845 | 62.9 | 89.2 | 10.8 | ||
| Chemical engineering | 10,166 | 3,292 | 32.4 | 72.8 | 27.2 | 6,874 | 67.6 | 93.8 | 6.2 | ||
| Civil engineering | 21,132 | 13,506 | 63.9 | 67.3 | 32.7 | 7,626 | 36.1 | 85.6 | 14.4 | ||
| Electrical, electronics, and communications engineering | 47,752 | 29,816 | 62.4 | 70.2 | 29.8 | 17,936 | 37.6 | 85.1 | 14.9 | ||
| Industrial and manufacturing engineering | 15,905 | 12,272 | 77.2 | 58.8 | 41.2 | 3,633 | 22.8 | 78.2 | 21.8 | ||
| Mechanical engineering | 27,428 | 16,279 | 59.4 | 66.2 | 33.8 | 11,149 | 40.6 | 87.4 | 12.6 | ||
| Metallurgical and materials engineering | 6,541 | 2,115 | 32.3 | 75.0 | 25.0 | 4,426 | 67.7 | 92.0 | 8.0 | ||
| Other engineering | 20,067 | 12,117 | 60.4 | 50.5 | 49.5 | 7,950 | 39.6 | 81.7 | 18.3 | ||
| Health | 67,963 | 52,662 | 77.5 | 68.0 | 32.0 | 15,301 | 22.5 | 72.4 | 27.6 | ||
| Clinical medicine | 29,693 | 25,283 | 85.1 | 59.5 | 40.5 | 4,410 | 14.9 | 73.9 | 26.1 | ||
| Other health | 38,270 | 27,379 | 71.5 | 75.8 | 24.2 | 10,891 | 28.5 | 71.8 | 28.2 | ||
SOURCE: National Science Foundation, National Center for Science and Engineering Statistics, Survey of Graduate Students and Postdoctorates in Science and Engineering, 2017.
Although the percentage of graduate students pursuing a master's degree varies among science, engineering, and health fields, the variation within these fields of study is even more pronounced. At one end of the spectrum, more than three-quarters of graduate students in the following fields were enrolled at the master's level: clinical medicine (85%), computer and information sciences (84%), and industrial and manufacturing engineering (77%). Conversely, in physical sciences, chemical engineering, and metallurgical and materials engineering, less than one-third of graduate students were enrolled at the master's level (15%, 32%, and 32%, respectively) (table 1).
A key benefit of separating master's and doctoral student enrollment counts in the GSS is that enrollment trends can be assessed across fields of study by degree level. As an example, the top three fields with the largest master's enrollment in 2017 were computer and information science (75,618 students), social sciences (41,208 students), and biological and biomedical sciences (33,926 students). For doctoral student enrollment, the top three fields in 2017 were biological and biomedical sciences (51,291 students), physical sciences (35,461 students), and social sciences (35,078 students) (table 1).
Graduate student enrollment status (part time or full time) also varied considerably by degree level and field of study. Eighty-seven percent of doctoral students were enrolled full time in 2017, as compared with 65% of master's students. Among master's students, only three broad fields enrolled at least three-quarters of their students full time in 2017: bioengineering and biomedical engineering (80%), metallurgical and materials engineering (75%), and other health (76%). In comparison, 19 of the 21 broad fields enrolled at least three-quarters of their doctoral students full time, with five of these fields enrolling more than 90% full time: biological and biomedical sciences (94%), chemical engineering (94%), physical sciences (93%), metallurgical and materials engineering (92%), and mathematics and statistics (91%) (table 1).
Demographic characteristics of graduate students enrolled in science and engineering (S&E) fields of study varied by degree level and enrollment status. For example, temporary visa holders in S&E fields were more likely than their U.S. citizens and permanent resident peers to be enrolled full time at both the master's and doctoral levels. Among doctoral students, 91% of temporary visa holders were enrolled full time, compared with 86% of U.S. citizens and permanent residents. This difference in enrollment status was much greater among master's students, where 82% of temporary visa holders were enrolled full time, compared with 54% of U.S. citizens and permanent residents (table 2).
| Characteristic | Master's | Doctoral | |||||||||
|---|---|---|---|---|---|---|---|---|---|---|---|
| Total | All | Percent of total |
Percent full time |
Percent part time |
All | Percent of total |
Percent full time |
Percent part time |
|||
a Race and ethnicity data are available for U.S. citizens and permanent residents only. SOURCE: National Science Foundation, National Center for Science and Engineering Statistics, Survey of Graduate Students and Postdoctorates in Science and Engineering, 2017. |
|||||||||||
| All surveyed fields | 649,112 | 378,587 | 58.3 | 64.7 | 35.3 | 270,525 | 41.7 | 87.2 | 12.8 | ||
| Science and engineering | 581,149 | 325,925 | 56.1 | 64.2 | 35.8 | 255,224 | 43.9 | 88.0 | 12.0 | ||
| Male | 339,317 | 188,466 | 55.5 | 62.7 | 37.3 | 150,851 | 44.5 | 88.1 | 11.9 | ||
| Female | 241,832 | 137,459 | 56.8 | 66.3 | 33.7 | 104,373 | 43.2 | 88.0 | 12.0 | ||
| U.S. citizens and permanent residentsa | 356,217 | 203,301 | 57.1 | 53.5 | 46.5 | 152,916 | 42.9 | 85.8 | 14.2 | ||
| Male | 192,434 | 109,191 | 56.7 | 49.1 | 50.9 | 83,243 | 43.3 | 85.5 | 14.5 | ||
| Female | 163,783 | 94,110 | 57.5 | 58.6 | 41.4 | 69,673 | 42.5 | 86.2 | 13.8 | ||
| Hispanic or Latino | 37,920 | 23,858 | 62.9 | 56.3 | 43.7 | 14,062 | 37.1 | 87.5 | 12.5 | ||
| Not Hispanic or Latino | |||||||||||
| American Indian or Alaska Native | 1,555 | 911 | 58.6 | 60.8 | 39.2 | 644 | 41.4 | 77.8 | 22.2 | ||
| Asian | 36,511 | 21,500 | 58.9 | 55.0 | 45.0 | 15,011 | 41.1 | 88.5 | 11.5 | ||
| Black or African American | 26,399 | 18,144 | 68.7 | 47.8 | 52.2 | 8,255 | 31.3 | 79.4 | 20.6 | ||
| Native Hawaiian or Other Pacific Islander | 573 | 361 | 63.0 | 51.5 | 48.5 | 212 | 37.0 | 82.5 | 17.5 | ||
| White | 221,438 | 119,792 | 54.1 | 53.6 | 46.4 | 101,646 | 45.9 | 85.7 | 14.3 | ||
| More than one race | 11,699 | 6,624 | 56.6 | 59.6 | 40.4 | 5,075 | 43.4 | 89.7 | 10.3 | ||
| Unknown race and ethnicity | 20,122 | 12,111 | 60.2 | 48.6 | 51.4 | 8,011 | 39.8 | 83.8 | 16.2 | ||
| Temporary visa holders | 224,932 | 122,624 | 54.5 | 81.9 | 18.1 | 102,308 | 45.5 | 91.4 | 8.6 | ||
| Male | 146,883 | 79,275 | 54.0 | 81.4 | 18.6 | 67,608 | 46.0 | 91.3 | 8.7 | ||
| Female | 78,049 | 43,349 | 55.5 | 83.0 | 17.0 | 34,700 | 44.5 | 91.6 | 8.4 | ||
Male and female S&E graduate students were similar in the proportion seeking master's degrees (56% and 57%, respectively) as well as their enrollment status across degree levels. However, there were gender differences in enrollment status across citizenship levels. Female U.S. citizens and permanent residents were enrolled full time at higher rates than were their male counterparts at the master's level (59% versus 49%, respectively). Whereas female temporary visa holders were enrolled full time at modestly higher rates than were their male counterparts at the master's level (83% versus 81%, respectively) (table 2).
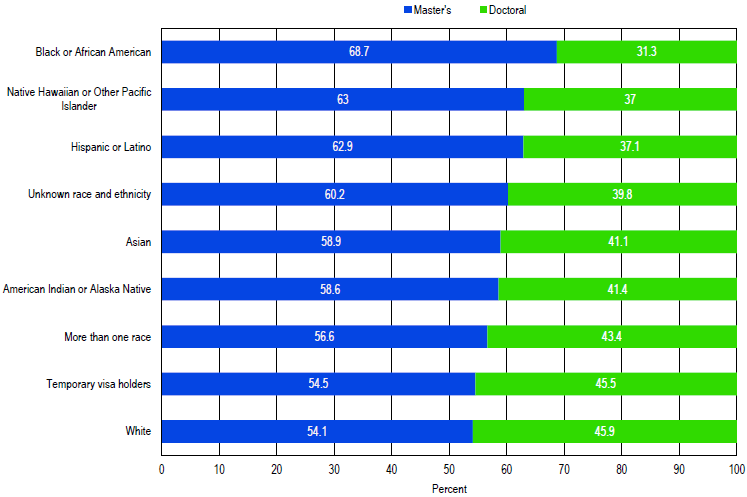
Key differences in enrollment can also be seen across racial and ethnic groups. The proportion of S&E graduate students seeking a master's degree was the highest among blacks or African Americans (69%), Native Hawaiians or Other Pacific Islanders (63%), and Hispanics (63%). Students with unknown race and ethnicity had the fourth highest proportion at the master's level (60%). Further, across racial and ethnic groups, only black or African American students (52%) and students of unknown race and ethnicity (51%) enrolled part time in master's programs more often than full time (figure 2 and table 2).
NOTE: Race and ethnicity data are available for U.S. citizens and permanent residents only.
SOURCE: National Science Foundation, National Center for Science and Engineering Statistics, Survey of Graduate Students and Postdoctorates in Science and Engineering, 2017.
Collecting financial support data by degree level allows greater insight into the differences in funding amounts and funding mechanisms that exist between master's and doctoral students. Although self-support is the primary source of support for just over one-third (37%) of all graduate students in S&E, there was a noticeable difference in self-support by degree level. Two-thirds (67%) of master's students and only one-tenth (10%) of doctoral students were self-supported (table 3).
| All full-time graduate students |
Master's | Doctoral | ||||||||
|---|---|---|---|---|---|---|---|---|---|---|
| Source and mechanism | Total | Percent | All | Percent | All | Percent | ||||
SOURCE: National Science Foundation, National Center for Science and Engineering Statistics, Survey of Graduate Students and Postdoctorates in Science and Engineering, 2017. |
||||||||||
| All full-time | 433,916 | 100.0 | 209,221 | 100.0 | 224,695 | 100.0 | ||||
| Self-support | 161,641 | 37.3 | 139,373 | 66.6 | 22,268 | 9.9 | ||||
| All sources of support | 272,275 | 62.7 | 69,848 | 33.4 | 202,427 | 90.1 | ||||
| Federal | 65,999 | 15.2 | 10,736 | 5.1 | 55,263 | 24.6 | ||||
| Department of Agriculture | 2,361 | 0.5 | 938 | 0.4 | 1,423 | 0.6 | ||||
| Department of Defense | 8,089 | 1.9 | 2,568 | 1.2 | 5,521 | 2.5 | ||||
| Department of Energy | 4,472 | 1.0 | 491 | 0.2 | 3,981 | 1.8 | ||||
| Health and Human Services (HHS) | 19,358 | 4.5 | 809 | 0.4 | 18,549 | 8.3 | ||||
| National Institutes of Health | 18,096 | 4.2 | 699 | 0.3 | 17,397 | 7.7 | ||||
| Other HHS | 1,262 | 0.3 | 110 | 0.1 | 1,152 | 0.5 | ||||
| National Aeronautics and Space Administration | 1,806 | 0.4 | 276 | 0.1 | 1,530 | 0.7 | ||||
| National Science Foundation | 20,815 | 4.8 | 2,192 | 1.0 | 18,623 | 8.3 | ||||
| Other | 9,098 | 2.1 | 3,462 | 1.7 | 5,636 | 2.5 | ||||
| Institutional | 182,135 | 42.0 | 52,319 | 25.0 | 129,816 | 57.8 | ||||
| Other U.S. source | 19,432 | 4.5 | 5,136 | 2.5 | 14,296 | 6.4 | ||||
| Foreign | 4,709 | 1.1 | 1,657 | 0.8 | 3,052 | 1.4 | ||||
| All mechanisms of support | 272,275 | 62.7 | 69,848 | 33.4 | 202,427 | 90.1 | ||||
| Fellowships | 39,368 | 9.1 | 5,687 | 2.7 | 33,681 | 15.0 | ||||
| Traineeships | 10,945 | 2.5 | 1,497 | 0.7 | 9,448 | 4.2 | ||||
| Research assistantships | 103,586 | 23.9 | 19,702 | 9.4 | 83,884 | 37.3 | ||||
| Teaching assistantships | 84,499 | 19.5 | 22,171 | 10.6 | 62,328 | 27.7 | ||||
| Other mechanisms | 33,877 | 7.8 | 20,791 | 9.9 | 13,086 | 5.8 | ||||
In terms of primary sources for funding support, doctoral students enrolled in S&E fields of study were most commonly (58%) funded through institutional sources, although one-quarter (25%) were primarily supported by federal sources. More than one-half (65%) of the doctoral students primarily supported by grants from federal agencies were supported by NSF (8.3% of all doctoral students) or by NIH (7.7% of all doctoral students). The most common primary mechanisms of support reported for doctoral students were research assistantships (37%), teaching assistantships (28%), and fellowships (15%) (table 3).
Unlike doctoral students, master's students were most commonly self-supported, leaving only 33% to be funded primarily through institutional support (25%), federal sources (5%), other U.S. sources (3%), or foreign sources (1%). Teaching assistantships were most commonly reported as the primary mechanism of support for master's students (11%). Another 9% were primarily supported by research assistantships, and 10% received their funding through other mechanisms of support (table 3).
Conducted since 1966, the GSS is an annual survey of all academic institutions in the United States that grant research-based master's or doctoral degrees in SEH fields. The 2017 GSS collected data from 18,745 organizational units (departments, programs, affiliated research centers, and health care facilities) at 703 eligible institutions and their affiliates in the United States, Puerto Rico, and Guam. The unit response rate was 97.6%. An overview of the survey is available at https://www.nsf.gov/statistics/srvygradpostdoc/.
In 2017, the GSS was redesigned to collect demographic and financial support data separately for master's and doctoral students, to prioritize electronic data interchange (EDI)[2] as the primary means of data submission, and to utilize the U.S. Department of Education's Classification of Instructional Programs (CIP)[3] codes to report fields of study for graduate student enrollment data. These methods were successfully piloted in the 2016 data collection and fully implemented for 2017. More information regarding the 2017 GSS redesign is available in the technical notes for the 2017 data tables (https://ncsesdata.nsf.gov/gradpostdoc/2017/gss_2017_tech_notes.pdf) and in the forthcoming companion InfoBrief (https://www.nsf.gov/statistics/srvygradpostdoc/).
Further, in 2017, NSF updated the GSS fields of study to align with the NCSES Taxonomy of Disciplines to increase comparability to other NCSES surveys and more accurately reflect how disciplines are currently organized. This update resulted in several fields becoming ineligible (including architecture, communication, and public administration) and the reorganization of subfields within and across broad fields. A special report is forthcoming that will provide more information about the updated GSS taxonomy.
Due to these changes, the 2017 data are not directly comparable to previously collected GSS data. Trend comparisons can be made using the "2017old" estimates in the 2017 data tables, available at https://www.nsf.gov/statistics/srvygradpostdoc/.
GSS health fields are collected under the advisement of NIH. These GSS fields are about one-third of all health fields in the U.S. Department of Education's CIP taxonomy. NIH information on trends seen within these selected health fields can be found at https://report.nih.gov/nihdatabook/.
The full set of data tables from the 2017 survey are available at https://www.nsf.gov/statistics/srvygradpostdoc/. Data are also available in NCSES's interactive data tool (https://ncsesdata.nsf.gov/ids/gss). For more information about the survey, contact the GSS project officer, Michael Yamaner.
[1] Caren A. Arbeit and Christopher Davies, RTI International, Research Triangle Park, NC. For information, contact Michael Yamaner, Human Resources Statistics Program, National Center for Science and Engineering Statistics, National Science Foundation, 2415 Eisenhower Avenue, Suite W14200, Alexandria, VA 22314 (myamaner@nsf.gov; 703-292-7815).
[2] Electronic data interchange (EDI) is a method for transferring data between computer systems or networks using a standardized format.
[3] CIP is a taxonomy used for reporting postsecondary fields to the U.S. Department of Education for the Integrated Postsecondary Education Data System, a mandatory survey for institutions receiving federal financial aid. Thus, most of institutions in the GSS already use CIP codes to report data on graduate students. The CIP taxonomy was developed by the National Center for Education Statistics, which updates the taxonomy about once a decade; CIP was last revised in 2010. For more information, see http://nces.ed.gov/ipeds/cipcode/.