SOURCE: National Center for Science and Engineering Statistics, Survey of Federal Science and Engineering Support to Universities, Colleges, and Nonprofit Institutions, FY 2018.
by Christopher Pece[1]
Science and engineering (S&E) support to historically black colleges and universities (HBCUs) was $320 million in FY 2018, an increase of 3.8% from FY 2017. This was the first increase HBCUs saw in 4 years, following annual declines in 2015, 2016, and 2017. Support to HBCUs for research and experimental development (R&D), the largest S&E component, was $247 million in FY 2018, an increase of 5.4% from 2017 (table 1).
| Fiscal year |
All federal obligations |
R&D | R&D plant |
Facilities and equipment for instruction in S&E |
Fellowships, traineeships, and training grants |
General support for S&E |
Other S&E activities |
|---|---|---|---|---|---|---|---|
HBCUs = historically black colleges and universities; S&E = science and engineering. NOTE: Detail may not add to total due to rounding. SOURCE: National Center for Science and Engineering Statistics, Survey of Federal Science and Engineering Support to Universities, Colleges, and Nonprofit Institutions. |
|||||||
| 2013 | 379,639 | 217,600 | 3,062 | 0 | 25,018 | 14,563 | 119,395 |
| 2014 | 408,387 | 241,643 | 10,116 | 0 | 66,131 | 16,247 | 74,250 |
| 2015 | 397,237 | 256,660 | 1,150 | 0 | 72,562 | 15,464 | 51,401 |
| 2016 | 372,978 | 257,894 | 2,210 | 0 | 56,529 | 5,166 | 51,180 |
| 2017 | 307,892 | 234,460 | 903 | 0 | 58,895 | 40 | 13,594 |
| 2018 | 319,684 | 247,103 | 1,412 | 0 | 60,786 | 95 | 10,289 |
More broadly, in FY 2018, federal agencies obligated $35.3 billion to higher education institutions in support of S&E, which includes R&D and other S&E activities, up 8.8% from the $32.4 billion obligated in FY 2017. In comparison, there was an increase of 2.5% from FY 2016 to FY 2017 (table 2).
| Fiscal year | All federal obligations |
R&D | R&D plant |
Facilities and equipment for instruction in S&E |
Fellowships, traineeships, and training grants |
General support for S&E |
Other S&E activities |
|---|---|---|---|---|---|---|---|
S&E = science and engineering. NOTE: Detail may not add to total due to rounding. SOURCE: National Center for Science and Engineering Statistics, Survey of Federal Science and Engineering Support to Universities, Colleges, and Nonprofit Institutions. |
|||||||
| 2013 | 29,407 | 26,156 | 273 | 4 | 894 | 132 | 1,948 |
| 2014 | 31,157 | 27,652 | 400 | 11 | 1,341 | 138 | 1,615 |
| 2015 | 30,561 | 27,105 | 371 | 4 | 1,347 | 138 | 1,596 |
| 2016 | 31,647 | 28,532 | 370 | 3 | 1,374 | 128 | 1,239 |
| 2017 | 32,440 | 29,805 | 432 | 3 | 1,371 | 96 | 732 |
| 2018 | 35,301 | 32,310 | 506 | 6 | 1,515 | 121 | 844 |
These and other estimates in this InfoBrief are from the FY 2018 Survey of Federal Science and Engineering Support to Universities, Colleges, and Nonprofit Institutions (Federal S&E Support Survey), conducted by the National Center for Science and Engineering Statistics (NCSES) within the National Science Foundation (NSF).
Federal S&E support includes six categories: R&D; R&D plant; facilities and equipment for instruction in S&E; fellowships, traineeships, and training grants (FTTGs); general support for S&E; and other S&E activities (see definitions in "Data Sources and Limitations"). Twenty higher education institutions receiving the largest amounts of federal S&E support accounted for 36.2% of all S&E support obligations by the federal government (table 3). Out of the $13 billion obligated to these 20 academic institutions to support S&E, 93.3% was for R&D, 4.1% for FTTGs, 2.1% for other S&E activities, and less than 1.0% for each of the following types of activities: R&D plant, general support for S&E, and facilities for instruction in S&E. These shares differ slightly from the ones for all other academic institutions. Of the $23 billion obligated to all other academic institutions, 90.5% was for R&D, 4.4% for FTTGs, 2.6% for other S&E support activities, 2.1% for R&D plant, and less than 1% for facilities for instruction in S&E and for general support for S&E.
| Institution | All federal obligations |
R&D | R&D plant | Facilities and equipment for instruction in S&E |
Fellowships, traineeships, and training grants |
General support for S&E |
Other S&E activities |
|---|---|---|---|---|---|---|---|
S&E = science and engineering. a Includes funding for Applied Physics Laboratory ($992.8 million for S&E obligations, all of which was for R&D). NOTE: Detail may not add to total because of rounding. SOURCE: National Center for Science and Engineering Statistics, Survey of Federal Science and Engineering Support to Universities, Colleges, and Nonprofit Institutions, FY 2018. |
|||||||
| All institutions | 35,301 | 32,310 | 506 | 6 | 1,515 | 121 | 844 |
| Top 20 institutions | 12,788 | 11,932 | 29 | 0 | 520 | 41 | 266 |
| Johns Hopkins U.a | 1,822 | 1,753 | 0 | 0 | 37 | 1 | 30 |
| U. Michigan | 755 | 704 | 0 | 0 | 31 | 1 | 20 |
| U. Washington | 755 | 666 | 3 | 0 | 59 | 0 | 28 |
| U. California, San Diego | 684 | 636 | 5 | 0 | 19 | 6 | 17 |
| U. California, San Francisco | 672 | 617 | 0 | 0 | 32 | 2 | 21 |
| Columbia U. in the City of New York | 647 | 602 | 1 | 0 | 28 | 3 | 13 |
| Stanford U. | 621 | 576 | 0 | 0 | 29 | 5 | 11 |
| U. Pittsburgh | 600 | 558 | 0 | 0 | 22 | 4 | 16 |
| U. Pennsylvania | 584 | 541 | 2 | 0 | 37 | 0 | 5 |
| Duke U. | 578 | 544 | 2 | 0 | 16 | 1 | 16 |
| U. Colorado Boulder | 564 | 517 | 3 | 0 | 31 | 2 | 10 |
| U. California, Los Angeles | 544 | 510 | 0 | 0 | 25 | 2 | 8 |
| Washington U., Saint Louis | 523 | 485 | 1 | 0 | 21 | 4 | 12 |
| U. North Carolina, Chapel Hill | 517 | 476 | 0 | 0 | 25 | 0 | 16 |
| Georgia Institute of Technology | 501 | 485 | 4 | 0 | 6 | 0 | 6 |
| Harvard U. | 500 | 464 | 2 | 0 | 26 | 2 | 6 |
| Yale U. | 498 | 467 | 1 | 0 | 21 | 3 | 6 |
| Pennsylvania State U. | 485 | 459 | 5 | 0 | 14 | 1 | 7 |
| U. Wisconsin-Madison | 482 | 451 | 1 | 0 | 22 | 3 | 4 |
| Northwestern U., Evanston | 455 | 422 | 1 | 0 | 18 | 1 | 13 |
| All other academic institutions | 22,513 | 20,378 | 477 | 6 | 995 | 80 | 578 |
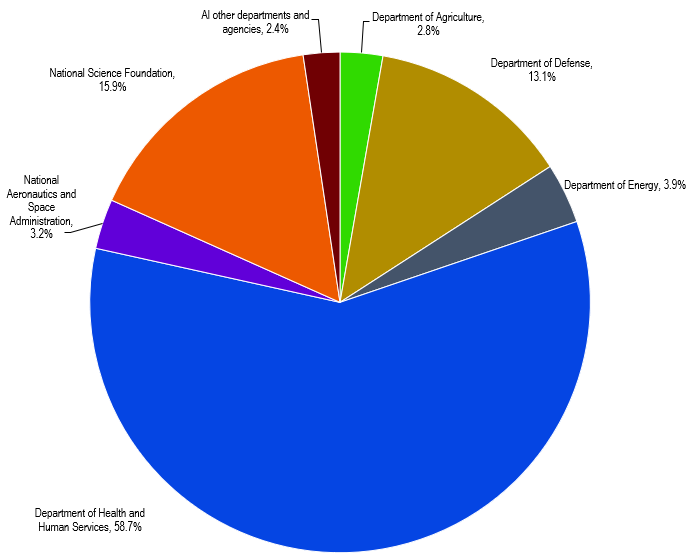
Six federal agencies accounted for 97.6% of all S&E support to higher education institutions in FY 2018: the Department of Health and Human Services (HHS), which includes the National Institutes of Health ($20.7 billion), NSF ($5.6 billion), the Department of Defense (DOD) ($4.6 billion), the Department of Energy (DOE) ($1.4 billion), the National Aeronautics and Space Administration (NASA) ($1.1 billion), and the Department of Agriculture (USDA) ($1.0 billion) (figure 1). Because obligations for R&D are the single largest share of total S&E support, these six agencies also accounted for 97.6% of all federal R&D obligations to the academic sector (details available in table 8 in the full set of data tables).
SOURCE: National Center for Science and Engineering Statistics, Survey of Federal Science and Engineering Support to Universities, Colleges, and Nonprofit Institutions, FY 2018.
Fifty-seven of the 105 HBCUs[2] received federal obligations for S&E activities in FY 2018, totaling $320 million (table 4). FY 2018 marked the first increase in federal S&E obligations to HBCUs since FY 2014, when obligations rose 7.6% to $408 million (table 1). In FY 2018, total R&D support to all HBCUs was $247 million, a 5.4% increase from the $234 million obligated in FY 2017.
The 20 HBCUs receiving the largest share of federal S&E support accounted for 74.9% of all S&E support obligations to HBCUs (table 4). These top 20 HBCUs also received 78.1% ($193 million) of all federal obligations for R&D to HBCUs, 64.0% ($39 million) of these obligations for FTTGs, and 100% of these obligations for both R&D plant and general support for S&E.
| Institution | All federal obligations |
R&D | R&D plant | Facilities and equipment for instruction in S&E |
Fellowships, traineeships, and training grants |
General support for S&E |
Other S&E activities |
|---|---|---|---|---|---|---|---|
* = amount > $0 but < $50. HBCUs = historically black colleges and universities; S&E = science and engineering. NOTE: Detail may not add to total because of rounding. SOURCE: National Center for Science and Engineering Statistics, Survey of Federal Science and Engineering Support to Universities, Colleges, and Nonprofit Institutions FY 2018. |
|||||||
| All HBCUs | 319,684 | 247,103 | 1,412 | 0 | 60,786 | 95 | 10,289 |
| Top 20 HBCUs | 239,488 | 192,937 | 1,412 | 0 | 38,881 | 95 | 6,163 |
| North Carolina Agricultural and Technical State U. | 24,231 | 20,872 | 0 | 0 | 3,170 | 0 | 189 |
| Morehouse School of Medicine | 19,587 | 18,408 | 0 | 0 | 327 | 0 | 852 |
| Howard U. | 18,839 | 13,772 | 299 | 0 | 4,549 | 0 | 219 |
| Tuskegee U. | 18,039 | 13,709 | 0 | 0 | 3,173 | 10 | 1,147 |
| Meharry Medical C. | 16,991 | 14,097 | 0 | 0 | 2,261 | 0 | 633 |
| North Carolina Central U. | 14,750 | 12,311 | 466 | 0 | 1,973 | 0 | 0 |
| Tennessee State U. | 12,393 | 8,915 | 0 | 0 | 3,243 | 0 | 235 |
| Florida A&M U. | 11,270 | 8,394 | 0 | 0 | 1,238 | 0 | 1,639 |
| Xavier U., Louisiana | 11,213 | 8,994 | 0 | 0 | 1,839 | 0 | 380 |
| Delaware State U. | 9,519 | 8,570 | 0 | 0 | 768 | 10 | 171 |
| Jackson State U. | 9,286 | 7,122 | 0 | 0 | 1,713 | 0 | 450 |
| Prairie View A&M U. | 9,197 | 7,861 | 0 | 0 | 1,087 | 0 | 249 |
| Morgan State U. | 9,062 | 6,845 | 0 | 0 | 2,217 | 0 | * |
| Hampton U. | 9,006 | 6,377 | 0 | 0 | 2,628 | 0 | 0 |
| Alabama A&M U. | 8,931 | 5,351 | 629 | 0 | 2,951 | 0 | 0 |
| U. of the Virgin Islands | 8,590 | 7,417 | 0 | 0 | 1,173 | 0 | 0 |
| Norfolk State U. | 8,584 | 7,543 | 18 | 0 | 1,023 | 0 | 0 |
| Virginia State U. | 7,543 | 6,541 | 0 | 0 | 927 | 75 | 0 |
| Texas Southern U. | 6,616 | 5,014 | 0 | 0 | 1,601 | 0 | 0 |
| Clark Atlanta U. | 5,844 | 4,824 | 0 | 0 | 1,020 | 0 | 0 |
| All other HBCUs | 80,196 | 54,166 | 0 | 0 | 21,905 | 0 | 4,126 |
In FY 2018, five federal agencies—NSF, HHS, USDA, DOD, and DOE—accounted for 97.3% of all federal obligations for S&E support to HBCUs (table 5). NSF provided the most S&E support, accounting for $102 million, or 32.1% of all federal S&E obligations to HBCUs. HHS obligated $97 million in S&E support, or 30.3% of the total, and USDA followed with $79 million, or 24.8% of all federal S&E support to HBCUs. Obligations by DOD and by DOE accounted for 6.6% and 3.6%, respectively. In terms of R&D obligations to HBCUs, HHS leads all agencies with 34.0% of total R&D obligations to HBCUs ($84 million), followed by USDA ($68 million, or 27.5%), NSF ($62 million, or 25.2%), DOD ($19 million, or 7.7%), and DOE ($11 million, or 4.6%) (details available in table 25 in the full set of data tables).
| Institution | All agencies | DOD | DOE | ED | HHS | NASA | NSF | USDA | Other agenciesa |
|---|---|---|---|---|---|---|---|---|---|
DOD = Department of Defense; DOE = Department of Energy; ED = Department of Education; HBCUs = historically black colleges and universities; HHS = Department of Health and Human Services; NASA = National Aeronautics and Space Administration; NSF = National Science Foundation; USDA = Department of Agriculture. aIncludes data for the following agencies: the Departments of Commerce, Homeland Security, the Interior, and Transportation and the Social Security Administration. NOTE: Detail may not add to total because of rounding. SOURCE: National Center for Science and Engineering Statistics, Survey of Federal Science and Engineering Support to Universities, Colleges, and Nonprofit Institutions, FY 2018. |
|||||||||
| All HBCUs | 319,684 | 21,104 | 11,383 | 6,264 | 96,938 | 1,912 | 102,499 | 79,128 | 456 |
| Top 20 HBCUs | 239,488 | 16,289 | 11,383 | 2,399 | 87,905 | 1,877 | 76,234 | 43,006 | 395 |
| North Carolina Agricultural and Technical State U. | 24,231 | 2,168 | 2,960 | 0 | 1,817 | 0 | 9,273 | 8,012 | 0 |
| Morehouse School of Medicine | 19,587 | 852 | 0 | 0 | 18,735 | 0 | 0 | 0 | 0 |
| Howard U. | 18,839 | 964 | 0 | 0 | 7,682 | 56 | 10,012 | 0 | 125 |
| Tuskegee U. | 18,039 | 2,343 | 0 | 0 | 3,219 | 0 | 7,125 | 5,352 | 0 |
| Meharry Medical C. | 16,991 | 0 | 0 | 250 | 16,741 | 0 | 0 | 0 | 0 |
| North Carolina Central U. | 14,750 | 0 | 0 | 266 | 8,012 | 0 | 6,472 | 0 | 0 |
| Tennessee State U. | 12,393 | 228 | 0 | 235 | 1,468 | 0 | 3,115 | 7,077 | 270 |
| Florida A&M U. | 11,270 | 270 | 3,476 | 867 | 2,622 | 0 | 3,794 | 242 | 0 |
| Xavier U., Louisiana | 11,213 | 1,494 | 0 | 0 | 7,362 | 0 | 2,357 | 0 | 0 |
| Delaware State U. | 9,519 | 1,591 | 0 | 82 | 3,569 | 0 | 1,562 | 2,715 | 0 |
| Jackson State U. | 9,286 | 1,592 | 0 | 450 | 2,330 | 0 | 4,914 | 0 | 0 |
| Prairie View A&M U. | 9,197 | 0 | 0 | 249 | 112 | 211 | 1,800 | 6,825 | 0 |
| Morgan State U. | 9,062 | 150 | 0 | 0 | 5,240 | 689 | 2,983 | 0 | 0 |
| Hampton U. | 9,006 | 2,625 | 601 | 0 | 1,625 | 921 | 3,234 | 0 | 0 |
| Alabama A&M U. | 8,931 | 676 | 0 | 0 | 0 | 0 | 2,702 | 5,553 | 0 |
| U. of the Virgin Islands | 8,590 | 15 | 0 | 0 | 554 | 0 | 6,304 | 1,717 | 0 |
| Norfolk State U. | 8,584 | 721 | 4,345 | 0 | 0 | 0 | 3,518 | 0 | 0 |
| Virginia State U. | 7,543 | 0 | 0 | 0 | 0 | 0 | 2,029 | 5,514 | 0 |
| Texas Southern U. | 6,616 | 0 | 0 | 0 | 3,223 | 0 | 3,392 | 0 | 0 |
| Clark Atlanta U. | 5,844 | 600 | 0 | 0 | 3,595 | 0 | 1,649 | 0 | 0 |
| All other HBCUs | 80,196 | 4,815 | 0 | 3,865 | 9,033 | 35 | 26,265 | 36,122 | 62 |
Among other minority-serving institutions, high-Hispanic-enrollment institutions (HHEs)[3] received $4.4 billion in federal obligations for S&E support in FY 2018 (table 6). Federal support to HHEs for R&D amounted to $4.0 billion, or 90.0% of total federal S&E support to HHEs. By comparison, R&D accounted for 77.3% of the S&E total obligations to HBCUs and for 91.5% of federal S&E support to all higher education institutions. The majority (59.9%) of the FY 2018 S&E support to HHEs came from HHS, with nearly $2.7 billion in obligations. NSF was the second-leading federal agency to obligate funding to support S&E at HHEs, with nearly $830 million (18.7%) (details available in table 26 in the full set of data tables).
| Institution | All federal obligations |
R&D | R&D plant | Facilities and equipment for instruction in S&E |
Fellowships, traineeships, and training grants |
General support for S&E |
Other S&E activities |
|---|---|---|---|---|---|---|---|
HHEs = high-Hispanic-enrollment institutions; S&E = science and engineering. a Excludes obligations for the university's foundation or auxiliary organization or some campuses or branches because those are not HHE institutions. NOTES: Detail may not add to total because of rounding. Institution order is based on total actual dollars received before amounts are rounded. Only those agencies that had obligations in the variables represented by this table appear in the table. This list of HHE institutions includes those institutions of higher education whose full-time equivalent (FTE) enrollment of undergraduate students is at least 25% Hispanic, according to fall 2018 enrollment data self-reported by the institutions in the Integrated Postsecondary Education Data System survey conducted by the National Center for Education Statistics (NCES). NCES determined FTE enrollment by calculating that approximately three part-time students are equivalent to one full-time student. SOURCE: National Center for Science and Engineering Statistics, Survey of Federal Science and Engineering Support to Universities, Colleges, and Nonprofit Institutions FY 2018. |
|||||||
| All HHEs | 4,442,397 | 3,998,042 | 94,759 | 0 | 209,415 | 22,981 | 117,201 |
| Top 20 HHEs | 3,881,599 | 3,550,757 | 87,948 | 0 | 132,924 | 19,748 | 90,223 |
| U. California, San Diegoa | 683,250 | 635,718 | 4,559 | 0 | 19,445 | 6,305 | 17,223 |
| U. California, Los Angeles | 544,389 | 509,919 | 9 | 0 | 24,556 | 1,736 | 8,170 |
| U. Texas, Austin | 360,615 | 284,126 | 62,266 | 0 | 10,132 | 0 | 4,090 |
| U. California, Davis | 353,263 | 331,185 | 560 | 0 | 10,139 | 1,639 | 9,741 |
| U. Colorado Bouldera | 246,152 | 224,313 | 0 | 0 | 11,485 | 501 | 9,853 |
| U. Arizona | 238,551 | 214,445 | 2,880 | 0 | 12,218 | 600 | 8,409 |
| U. California, Irvine | 228,918 | 221,670 | 400 | 0 | 5,691 | 0 | 1,157 |
| U. Miamia | 166,547 | 160,221 | 0 | 0 | 3,074 | 0 | 3,252 |
| U. Illinois, Chicago | 161,943 | 145,678 | 1,013 | 0 | 5,399 | 0 | 9,853 |
| U. Texas M. D. Anderson Cancer Center | 151,198 | 141,562 | 0 | 0 | 2,580 | 1,197 | 5,860 |
| U. New Mexico | 114,559 | 102,284 | 2,085 | 0 | 6,228 | 0 | 3,961 |
| U. California, Santa Barbara | 108,407 | 105,293 | 1,842 | 0 | 1,273 | 0 | 0 |
| U. Texas Health Science Center, Houstona | 91,463 | 88,944 | 0 | 0 | 2,498 | 0 | 21 |
| U. Texas Health Science Center, San Antonio | 87,621 | 77,225 | 0 | 0 | 3,843 | 0 | 6,553 |
| U. California, Riverside | 78,246 | 74,820 | 599 | 0 | 2,568 | 0 | 260 |
| U. Central Florida | 71,791 | 71,145 | 0 | 0 | 362 | 0 | 284 |
| U. California, Santa Cruz | 59,752 | 51,180 | 2,809 | 0 | 2,712 | 3,044 | 6 |
| Florida International U. | 59,558 | 48,432 | 1,042 | 0 | 4,619 | 4,292 | 1,174 |
| New Mexico State U., Las Cruces | 40,430 | 36,245 | 83 | 0 | 3,307 | 435 | 360 |
| U. Puerto Rico, Medical Sciences Campus | 34,949 | 26,354 | 7,800 | 0 | 795 | 0 | 0 |
| All other HHE institutions | 560,799 | 447,285 | 6,812 | 0 | 76,491 | 3,233 | 26,978 |
NCSES collects statistics on federal obligations to independent nonprofit institutions for two of the six S&E support categories, namely, R&D and R&D plant. During FY 2018, federal agencies obligated $7.3 billion in R&D and R&D plant to 922 nonprofit institutions (table 7). The Patient-Centered Outcomes Research Institute received the most in federal funds for R&D and R&D plant ($492 million).
| Institution | All federal obligations |
HHS | DOD | NSF | NASA | DOE | Other agenciesa |
|---|---|---|---|---|---|---|---|
DOD = Department of Defense; DOE = Department of Energy; HHS = Department of Health and Human Services; NASA = National Aeronautics and Space Administration; NSF = National Science Foundation. a Includes data for the following agencies: the Departments of Commerce, Education, Homeland Security, Housing and Urban Development, the Interior, Justice, Labor, and Transportation; the Agency for International Development; the Environmental Protection Agency; the Appalachian Regional Commission; the Nuclear Regulatory Commission; Patient-Centered Outcomes Research Trust Fund; and the Social Security Administration. NOTE: Detail may not add to total due to rounding. SOURCE: National Center for Science and Engineering Statistics, Survey of Federal Science and Engineering Support to Universities, Colleges, and Nonprofit Institutions, FY 2018. |
|||||||
| All institutions | 7,274,293 | 4,924,365 | 930,295 | 330,568 | 258,876 | 112,753 | 717,436 |
| Top 10 nonprofit institutions | 2,904,440 | 1,793,841 | 493,085 | 100,861 | 3,481 | 15,250 | 497,923 |
| Patient-Centered Outcomes Research Institute | 491,715 | 0 | 0 | 0 | 0 | 0 | 491,715 |
| Massachusetts General Hospital | 465,109 | 451,964 | 12,552 | 364 | 230 | 0 | 0 |
| Brigham and Women's Hospital | 370,959 | 368,718 | 1,358 | 406 | 477 | 0 | 0 |
| Fred Hutchinson Cancer Research Center | 305,891 | 304,817 | 927 | 147 | 0 | 0 | 0 |
| Battelle Memorial Institute, all locations | 298,469 | 25,057 | 177,978 | 80,958 | 169 | 14,034 | 274 |
| Mayo Clinic | 272,133 | 261,156 | 10,441 | 536 | 0 | 0 | 0 |
| Henry M. Jackson Foundation for the Advancement of Military Medicine | 223,301 | 17,995 | 205,306 | 0 | 0 | 0 | 0 |
| Dana-Farber Cancer Institute | 169,423 | 167,882 | 63 | 264 | 0 | 1,215 | 0 |
| Children's Hospital Boston | 155,956 | 155,801 | 0 | 155 | 0 | 0 | 0 |
| SRI International | 151,485 | 40,452 | 84,461 | 18,032 | 2,606 | 0 | 5,935 |
| All other nonprofit institutions | 4,369,852 | 3,130,525 | 437,210 | 229,707 | 255,395 | 97,503 | 219,513 |
Data in this InfoBrief were not adjusted for inflation. Data were obtained from the 20 agencies (12 federal departments and 8 independent agencies) that made S&E obligations to academic and nonprofit institutions in FY 2018, as reported to the Federal S&E Support Survey. The survey collects federal S&E support data by funding agency, institution, type of activity, type of institution, and geographic location.
The six funding categories of federal S&E support are defined as follows:
The full set of data tables on the FY 2018 Federal S&E Support Survey are available at https://www.nsf.gov/statistics/srvyfedsupport/. Data for the survey are available in NCSES's interactive data tool (https://ncsesdata.nsf.gov/ids/fss). For more information, please contact the author.
[1] Christopher Pece, Research and Development Statistics Program, National Center for Science and Engineering Statistics, National Science Foundation, 2415 Eisenhower Avenue, Suite W14200, Alexandria, VA 22314 (cpece@nsf.gov; 703-292-7788).
[2] The Higher Education Act of 1965, as amended, defines an HBCU as "any historically black college or university that was established prior to 1964, whose principal mission was, and is, the education of black Americans, and that is accredited by a nationally recognized accrediting agency or association determined by the Secretary (of Education) to be a reliable authority as to the quality of training offered or is, according to such an agency or association, making reasonable progress toward accreditation."
[3] HHEs are those institutions whose full-time equivalent (FTE) enrollment of undergraduate students is at least 25% Hispanic, according to fall 2018 enrollment data self-reported by the institutions in the Integrated Postsecondary Education Data System survey conducted by the National Center for Education Statistics (NCES). NCES determined FTE enrollment by calculating that approximately three part-time students are equivalent to one full-time student.