Job market
Non-science and engineering
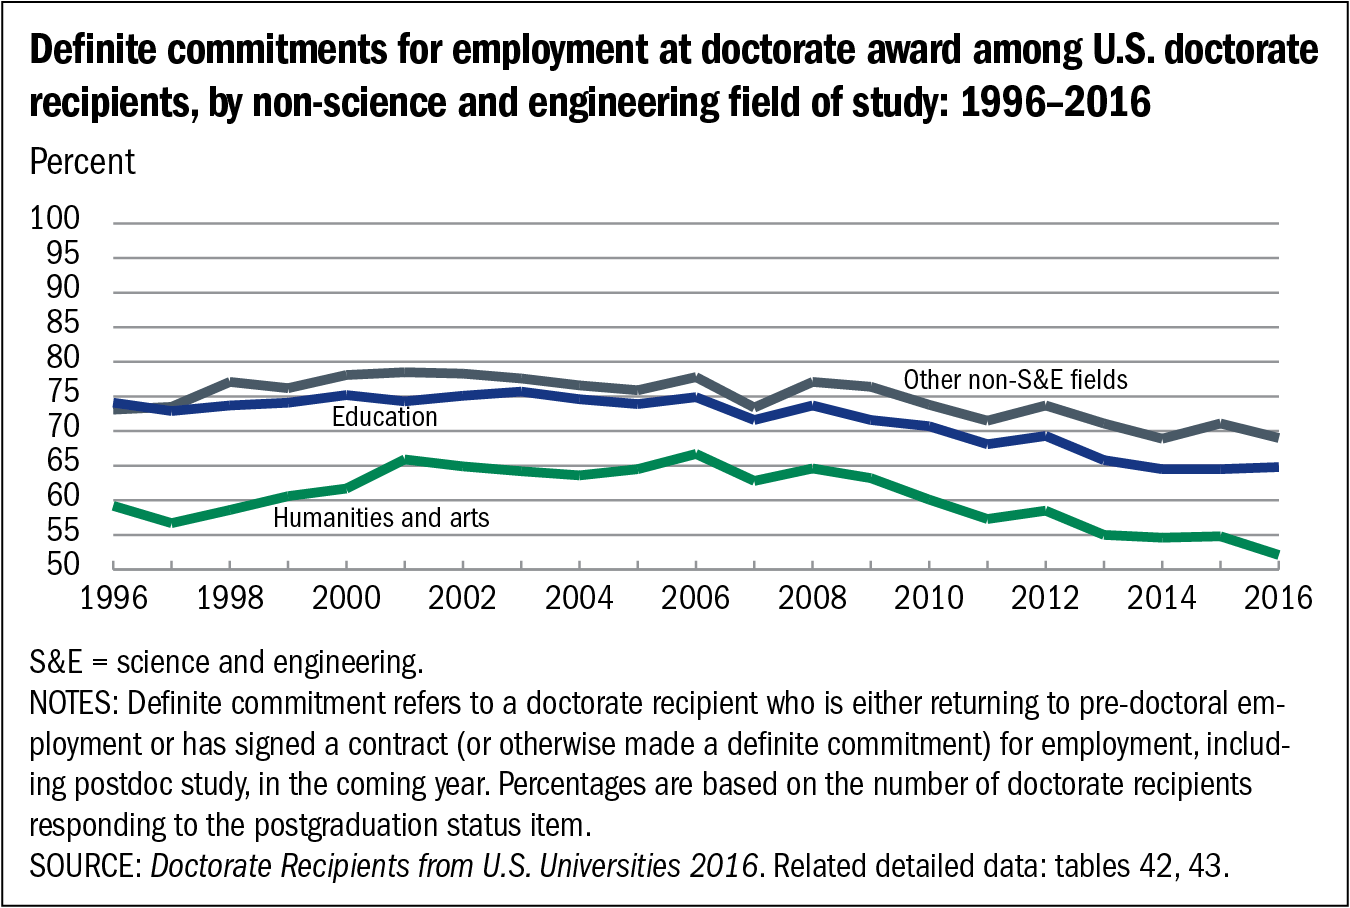
For doctorate recipients in non-S&E fields, the proportion of doctorate recipients with definite commitments for employment, including postdoc study, has been in decline since 2008. In 2016, the share of doctorate recipients with definite commitments remained at or near the 20-year low points in education, humanities and arts, and other non-S&E fields.
Definite commitments for employment at doctorate award among U.S. doctorate recipients, by non-science and engineering field of study: 1996–2016
| Year | All fields | Education | Humanities and arts | Other non-S&E fields |
|---|---|---|---|---|
| 1996 | 67.5 | 74.1 | 59.2 | 73.1 |
| 1997 | 67.4 | 72.9 | 56.7 | 73.5 |
| 1998 | 69.7 | 73.7 | 58.6 | 77.1 |
| 1999 | 69.9 | 74.1 | 60.6 | 76.2 |
| 2000 | 71.2 | 75.2 | 61.7 | 78.1 |
| 2001 | 72.9 | 74.3 | 65.9 | 78.5 |
| 2002 | 72.5 | 75.1 | 64.9 | 78.3 |
| 2003 | 71.3 | 75.7 | 64.2 | 77.6 |
| 2004 | 70.0 | 74.6 | 63.6 | 76.6 |
| 2005 | 70.5 | 73.9 | 64.5 | 75.9 |
| 2006 | 71.6 | 74.9 | 66.7 | 77.8 |
| 2007 | 68.7 | 71.6 | 62.8 | 73.4 |
| 2008 | 69.2 | 73.7 | 64.6 | 77.1 |
| 2009 | 69.5 | 71.6 | 63.2 | 76.4 |
| 2010 | 68.1 | 70.7 | 60.1 | 73.8 |
| 2011 | 65.5 | 68.1 | 57.3 | 71.5 |
| 2012 | 65.9 | 69.3 | 58.5 | 73.7 |
| 2013 | 62.6 | 65.8 | 55.0 | 71.1 |
| 2014 | 61.4 | 64.5 | 54.6 | 68.9 |
| 2015 | 62.0 | 64.5 | 54.8 | 71.1 |
| 2016 | 61.8 | 64.8 | 52.1 | 69.0 |
- S&E = science and engineering.
- NOTES: Definite commitment refers to a doctorate recipient who is either returning to pre-doctoral employment or has signed a contract (or otherwise made a definite commitment) for employment, including postdoc study, in the coming year. Percentages are based on the number of doctorate recipients responding to the postgraduation status item.
- SOURCE: Doctorate Recipients from U.S. Universities 2016. Related detailed data: tables 42, 43.