Education-related debt
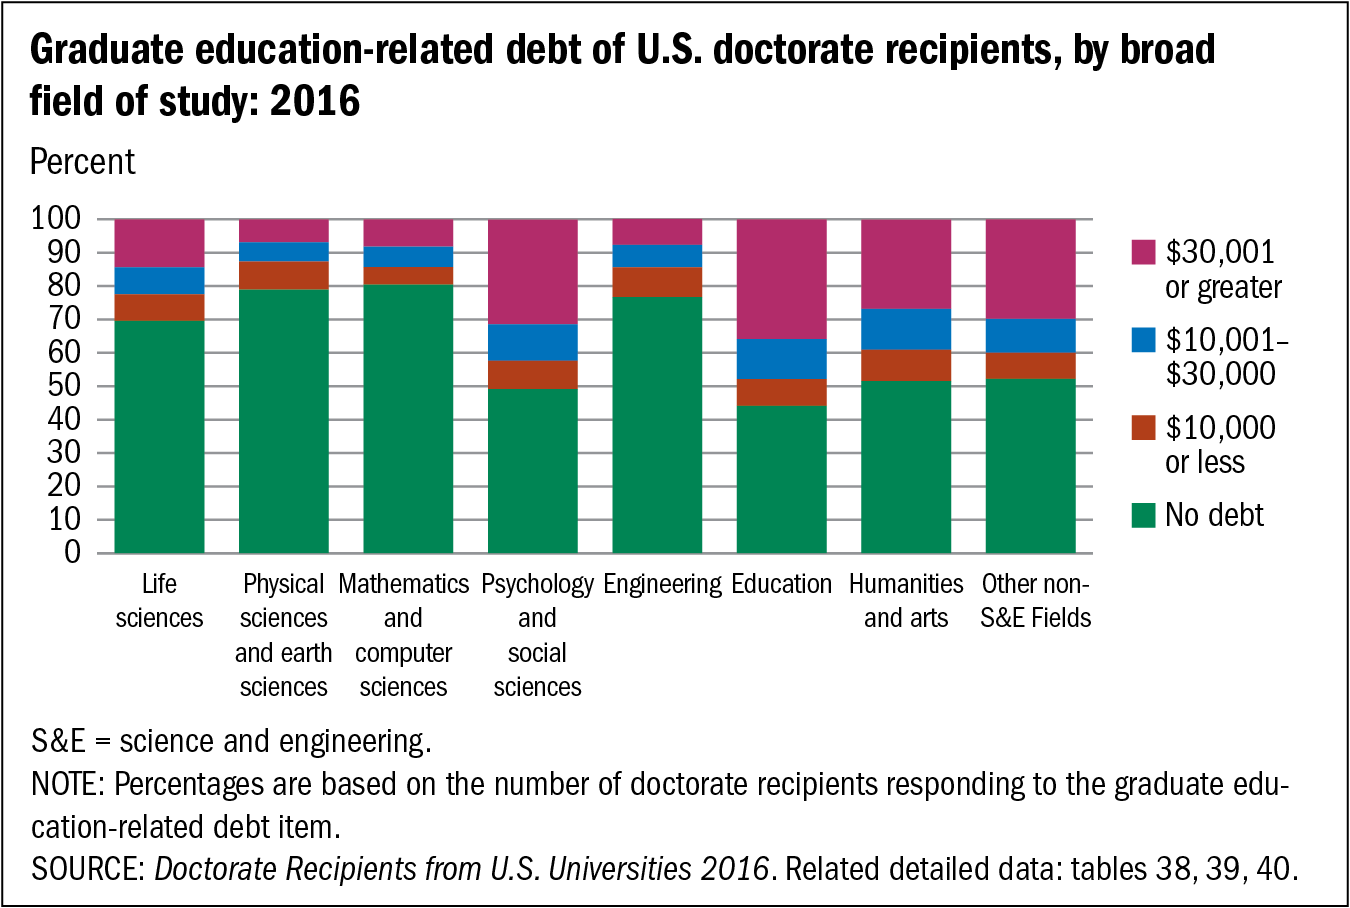
The amount of education-related debt incurred by doctorate recipients during graduate school is an indicator of the availability of financial support. In 2016, more than two-thirds of doctorate recipients in life sciences and more than three-quarters of those in physical sciences and earth sciences, mathematics and computer sciences, and engineering reported holding no debt related to their graduate education when they were awarded the doctorate. In psychology and social sciences, humanities and arts, and other non-S&E fields, that proportion dropped to around one-half.
Within each broad field of study, 5% to 9% of doctorate recipients had incurred low levels ($10,000 or less) of education-related debt by the time they graduated. The shares of doctoral graduates with education-related debt burdens over $30,000 were greatest in education (36%), psychology and social sciences (31%), other non-S&E fields (30%), and humanities and arts (27%).
Graduate education-related debt of U.S. doctorate recipients, by broad field of study: 2016
| Level of graduate school debt | Life sciences | Physical sciences and earth sciences | Mathematics and computer sciences | Psychology and social sciences | Engineering | Education | Humanities and arts | Other non-S&E fields | ||||||||
|---|---|---|---|---|---|---|---|---|---|---|---|---|---|---|---|---|
| Number | Percent | Number | Percent | Number | Percent | Number | Percent | Number | Percent | Number | Percent | Number | Percent | Number | Percent | |
| No debt | 8,108 | 69.6 | 4,527 | 78.9 | 2,883 | 80.4 | 3,975 | 49.1 | 6,551 | 76.7 | 2,035 | 44.1 | 2,548 | 51.5 | 1,361 | 52.2 |
| $10,000 or less | 916 | 7.9 | 483 | 8.4 | 190 | 5.3 | 689 | 8.5 | 758 | 8.9 | 369 | 8.0 | 467 | 9.4 | 203 | 7.8 |
| $10,001–$30,000 | 943 | 8.1 | 334 | 5.8 | 217 | 6.1 | 883 | 10.9 | 570 | 6.7 | 556 | 12.0 | 611 | 12.3 | 266 | 10.2 |
| $30,001 or greater | 1,681 | 14.4 | 397 | 6.9 | 295 | 8.2 | 2,544 | 31.4 | 665 | 7.8 | 1,656 | 35.9 | 1,323 | 26.7 | 778 | 29.8 |
- S&E = science and engineering.
- NOTE: Percentages are based on the number of doctorate recipients responding to the graduate education-related debt item.
- SOURCE: Doctorate Recipients from U.S. Universities 2016. Related detailed data: tables 38, 39, 40.