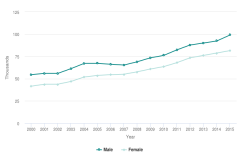
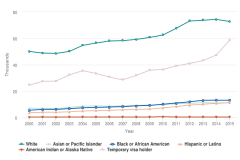
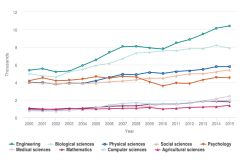
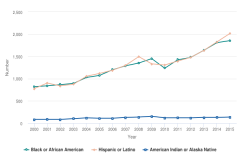
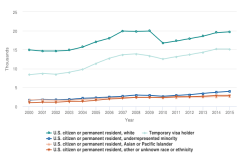
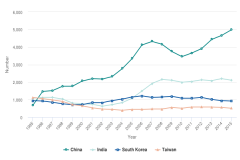
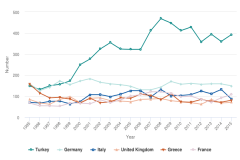
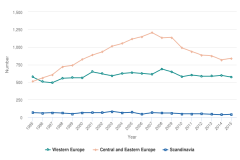
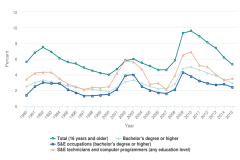
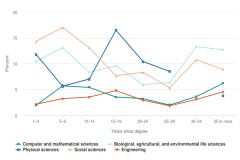
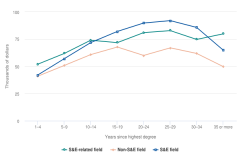
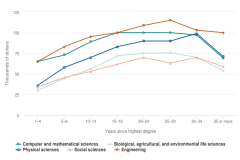
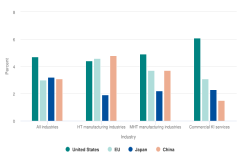
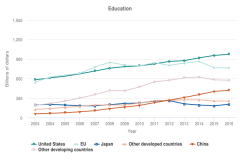
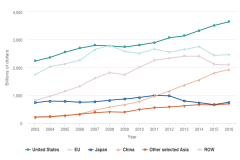
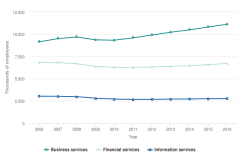
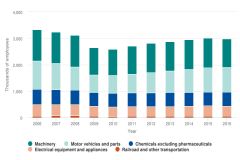
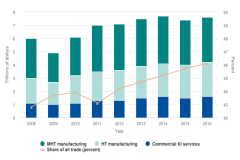
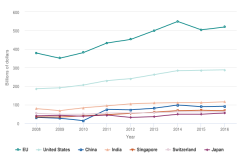
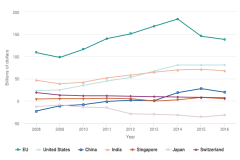
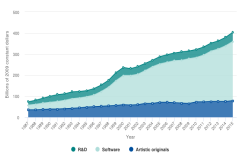
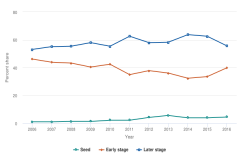
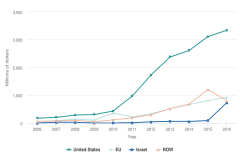
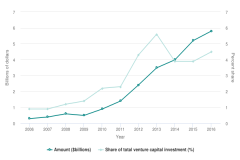
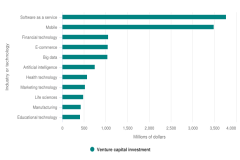
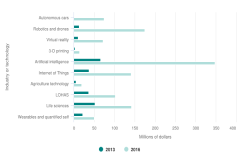
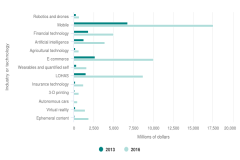
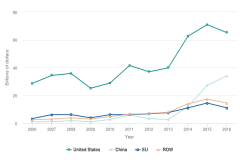
Select a thumbnail to see the figure. PDF, PNG, and source Excel are available for download.
Chapter 1. Elementary and Secondary Mathematics and Science Education
Chapter 5. Academic Research and Development
Overview of the State of the U.S. S&E Enterprise in a Global Context
| FIGURE | TITLE | VIEW | EXCEL | PNG | |
|---|---|---|---|---|---|
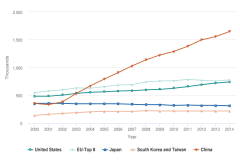
| O-1 | Bachelor's degree awards in S&E fields, by selected region, country, or economy: 2000–14 | View Figure | Download PDF | Download XLSX | Download PNG |
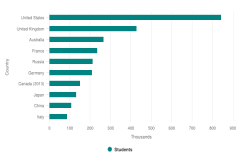
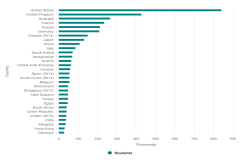
| O-2 | Internationally mobile students enrolled in tertiary education, by selected country: 2014 | View Figure | Download PDF | Download XLSX | Download PNG |
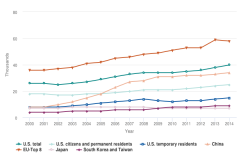
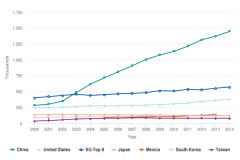
| O-3 | Doctoral degree awards in S&E fields, by selected region, country, or economy: 2000–14 | View Figure | Download PDF | Download XLSX | Download PNG |
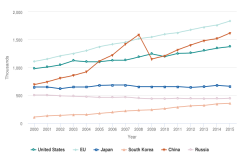
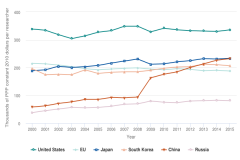
| O-4 | Estimated number of researchers, selected region or country: 2000–15 | View Figure | Download PDF | Download XLSX | Download PNG |
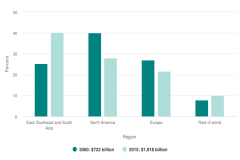
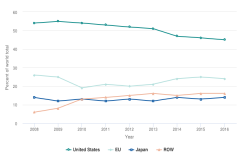
| O-5 | Regional share of worldwide R&D expenditures: 2000 and 2015 | View Figure | Download PDF | Download XLSX | Download PNG |
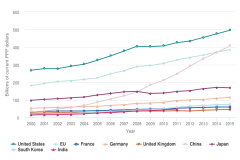
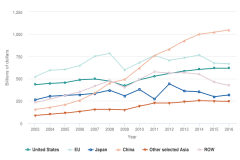
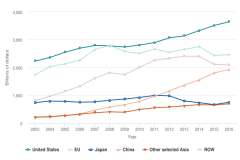
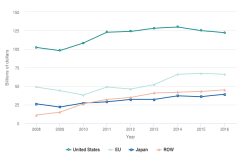
| O-6 | Gross domestic expenditures on R&D, by selected region, country, or economy: 2000–15 | View Figure | Download PDF | Download XLSX | Download PNG |
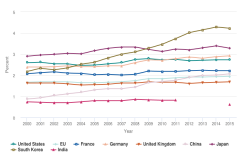
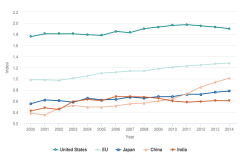
| O-7 | R&D intensity, by selected region, country, or economy: 2000–15 | View Figure | Download PDF | Download XLSX | Download PNG |
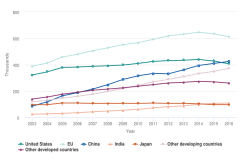
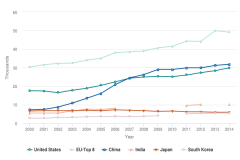
| O-8 | S&E articles, by selected region, country, or economy: 2003–16 | View Figure | Download PDF | Download XLSX | Download PNG |
| O-9 | S&E publication output in the top 1% of cited publications, by selected region, country, or economy: 2000–14 | View Figure | Download PDF | Download XLSX | Download PNG |
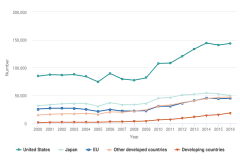
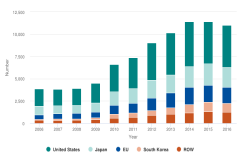
| O-10 | USPTO patents granted, by selected region, country, or economy of inventor: 2000–16 | View Figure | Download PDF | Download XLSX | Download PNG |
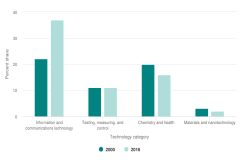
| O-11 | USPTO patents granted in selected broad technology categories: 2000 and 2016 | View Figure | Download PDF | Download XLSX | Download PNG |
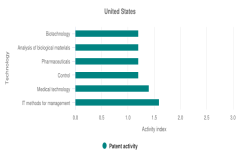
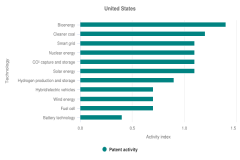
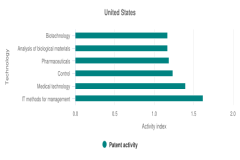
| O-12 | Patent activity index for selected technologies for the United States, EU, and Japan: 2014–16 | View Figure | Download PDF | Download XLSX | Download PNG |
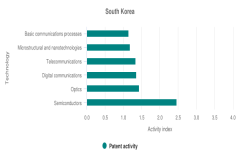
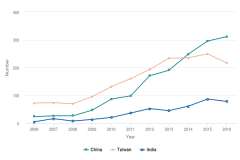
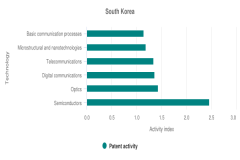
| O-13 | Patent activity index of selected technologies for South Korea, Taiwan, and China: 2014–16 | View Figure | Download PDF | Download XLSX | Download PNG |
| O-14 | Exports of intellectual property (charges for their use), by selected region, country, or economy: 2008–16 | View Figure | Download PDF | Download XLSX | Download PNG |
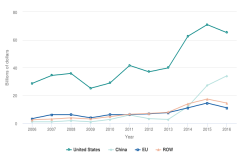
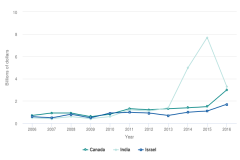
| O-15 | Early- and later-stage venture capital investment, by selected region, country, or economy: 2006–16 | View Figure | Download PDF | Download XLSX | Download PNG |
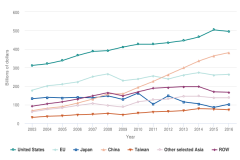
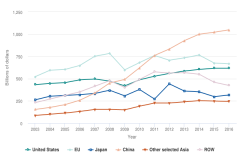
| O-16 | Output of HT manufacturing industries for selected regions, countries, or economies: 2003–16 | View Figure | Download PDF | Download XLSX | Download PNG |
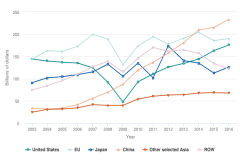
| O-17 | Output of MHT manufacturing industries for selected regions, countries, or economies: 2003–16 | View Figure | Download PDF | Download XLSX | Download PNG |
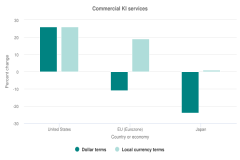
| O-18 | Output of commercial KI services industries for selected regions, countries, or economies: 2003–16 | View Figure | Download PDF | Download XLSX | Download PNG |
Chapter 1. Elementary and Secondary Mathematics and Science Education
| FIGURE | TITLE | VIEW | EXCEL | PNG | |
|---|---|---|---|---|---|
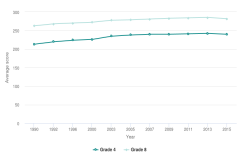
| 1-1 | Average NAEP mathematics scores of students in grades 4 and 8: 1990–2015 | View Figure | Download PDF | Download XLSX | Download PNG |
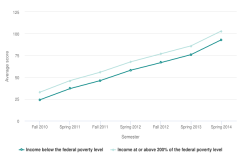
| 1-2 | Average mathematics assessment test scores of children who were in kindergarten for the first time during the 2010–11 school year and in the third grade during the 2013–14 school year, by family income level | View Figure | Download PDF | Download XLSX | Download PNG |
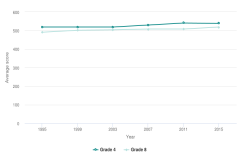
| 1-3 | Average TIMSS mathematics scores of U.S. students in grades 4 and 8: 1995–2015 | View Figure | Download PDF | Download XLSX | Download PNG |
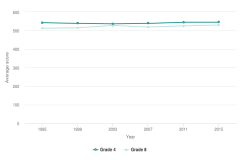
| 1-4 | Average TIMSS science scores of U.S. students in grades 4 and 8: 1995–2015 | View Figure | Download PDF | Download XLSX | Download PNG |
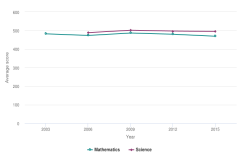
| 1-5 | Average mathematics and science literacy assessment scores of 15-year-old students in the United States: 2003–15 | View Figure | Download PDF | Download XLSX | Download PNG |
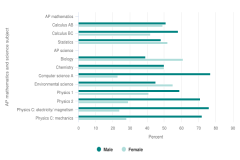
| 1-6 | Percentage distribution of high school students taking an AP exam in mathematics or science, by sex: 2016 | View Figure | Download PDF | Download XLSX | Download PNG |
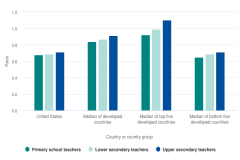
| 1-7 | Salaries of teachers in developed countries relative to earnings for tertiary educated workers: 2014 | View Figure | Download PDF | Download XLSX | Download PNG |
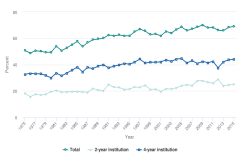
| 1-8 | Immediate college enrollment rates among high school graduates, by institution type: 1975–2015 | View Figure | Download PDF | Download XLSX | Download PNG |
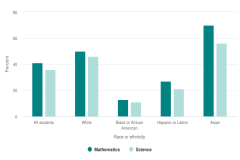
| 1-A | ACT-tested 2016 high school graduates meeting ACT college readiness benchmarks in mathematics and science | View Figure | Download PDF | Download XLSX | Download PNG |
Chapter 2. Higher Education in Science and Engineering
| FIGURE | TITLE | VIEW | EXCEL | PNG | |
|---|---|---|---|---|---|
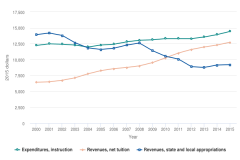
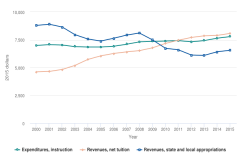
| 2-1 | Selected average revenues and expenditures per FTE at public very high research universities: 2000–15 | View Figure | Download PDF | Download XLSX | Download PNG |
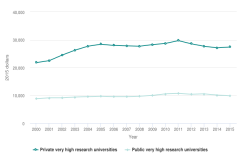
| 2-2 | Average expenditures per FTE on research at public and private very high research universities: 2000–15 | View Figure | Download PDF | Download XLSX | Download PNG |
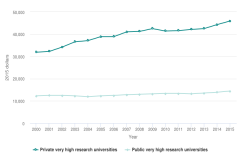
| 2-3 | Average expenditures per FTE on instruction at public and private very high research universities: 2000–15 | View Figure | Download PDF | Download XLSX | Download PNG |
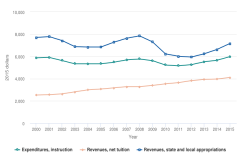
| 2-4 | Selected average revenues and expenditures at public 4-year and other postsecondary institutions: 2000–15 | View Figure | Download PDF | Download XLSX | Download PNG |
| 2-5 | Selected average revenues and expenditures per FTE at community colleges: 2000–15 | View Figure | Download PDF | Download XLSX | Download PNG |
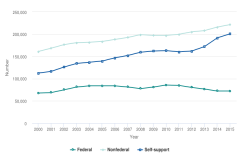
| 2-6 | Full-time S&E graduate students, by source of primary support: 2000–15 | View Figure | Download PDF | Download XLSX | Download PNG |
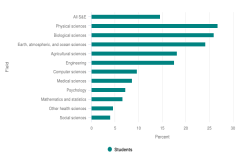
| 2-7 | Full-time S&E graduate students with primary support from federal government, by field: 2015 | View Figure | Download PDF | Download XLSX | Download PNG |
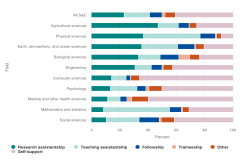
| 2-8 | Full-time S&E graduate students, by field and mechanism of primary support: 2015 | View Figure | Download PDF | Download XLSX | Download PNG |
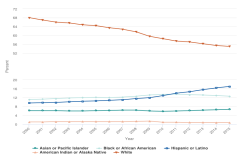
| 2-9 | Share of full-time undergraduate enrollment among U.S. citizens and permanent residents, by race and ethnicity: 2000–15 | View Figure | Download PDF | Download XLSX | Download PNG |
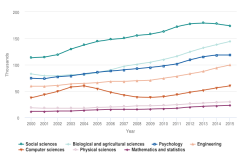
| 2-10 | S&E bachelor’s degrees, by field: 2000–15 | View Figure | Download PDF | Download XLSX | Download PNG |
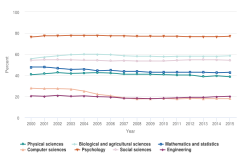
| 2-11 | Women's share of S&E bachelor's degrees, by field: 2000–15 | View Figure | Download PDF | Download XLSX | Download PNG |
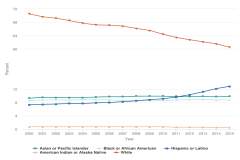
| 2-12 | Share of S&E bachelor’s degrees among U.S. citizens and permanent residents, by race and ethnicity: 2000–15 | View Figure | Download PDF | Download XLSX | Download PNG |
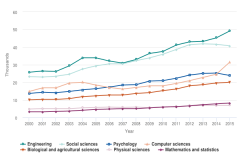
| 2-13 | S&E master's degrees, by field: 2000–15 | View Figure | Download PDF | Download XLSX | Download PNG |
| 2-14 | S&E master’s degrees, by sex of recipient: 2000–15 | View Figure | Download PDF | Download XLSX | Download PNG |
| 2-15 | S&E master’s degrees, by race, ethnicity, and citizenship: 2000–15 | View Figure | Download PDF | Download XLSX | Download PNG |
| 2-16 | S&E doctoral degrees earned in U.S. universities, by field: 2000–15 | View Figure | Download PDF | Download XLSX | Download PNG |
| 2-17 | S&E doctoral degrees earned by U.S. citizen and permanent resident underrepresented minorities, by race and ethnicity: 2000–15 | View Figure | Download PDF | Download XLSX | Download PNG |
| 2-18 | S&E doctoral degrees, by race, ethnicity, and citizenship: 2000–15 | View Figure | Download PDF | Download XLSX | Download PNG |
| 2-19 | U.S. S&E doctoral degree recipients, by selected Asian country or economy of origin: 1995–2015 | View Figure | Download PDF | Download XLSX | Download PNG |
| 2-20 | U.S. S&E doctoral degree recipients, by selected European country: 1995–2015 | View Figure | Download PDF | Download XLSX | Download PNG |
| 2-21 | U.S. S&E doctoral degree recipients from Europe, by region: 1995–2015 | View Figure | Download PDF | Download XLSX | Download PNG |
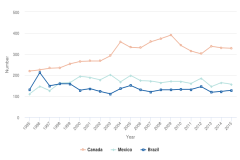
| 2-22 | U.S. S&E doctoral degree recipients from Canada, Mexico, and Brazil: 1995–2015 | View Figure | Download PDF | Download XLSX | Download PNG |
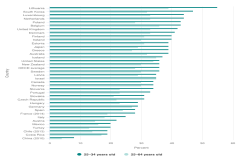
| 2-23 | Attainment of bachelor's or higher degrees, by country and age group: 2015 | View Figure | Download PDF | Download XLSX | Download PNG |
| 2-24 | First university natural sciences and engineering degrees, by selected country or economy: 2000–14 | View Figure | Download PDF | Download XLSX | Download PNG |
| 2-25 | Natural sciences and engineering doctoral degrees, by selected country: 2000–14 | View Figure | Download PDF | Download XLSX | Download PNG |
| 2-26 | Internationally mobile students enrolled in tertiary education, by selected country: 2014 | View Figure | Download PDF | Download XLSX | Download PNG |
Chapter 3. Science and Engineering Labor Force
| FIGURE | TITLE | VIEW | EXCEL | PNG | |
|---|---|---|---|---|---|
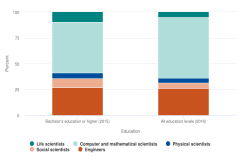
| 3-1 | Employment in S&E occupations, by broad occupational category: 2015 and 2016 | View Figure | Download PDF | Download XLSX | Download PNG |
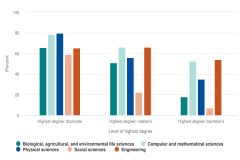
| 3-2 | S&E degrees among college graduates, by field and level of highest degree: 2015 | View Figure | Download PDF | Download XLSX | Download PNG |
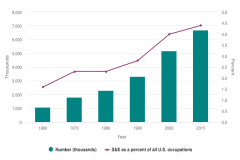
| 3-3 | Individuals employed in S&E occupations in the United States: Selected years, 1960–2015 | View Figure | Download PDF | Download XLSX | Download PNG |
| 3-4 | Average annual growth in the total number of employed individuals with highest degree in S&E, by field and level of highest degree: 2003–15 | View Figure | Download PDF | Download XLSX | Download PNG |
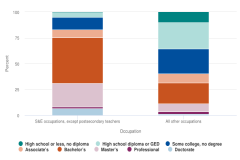
| 3-5 | Educational attainment, by type of occupation: 2015 | View Figure | Download PDF | Download XLSX | Download PNG |
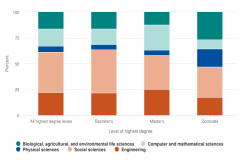
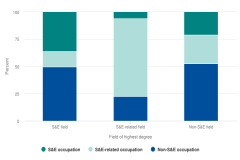
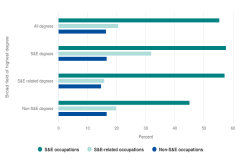
| 3-6 | Occupational distribution of scientists and engineers, by broad field of highest degree: 2015 | View Figure | Download PDF | Download XLSX | Download PNG |
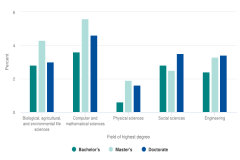
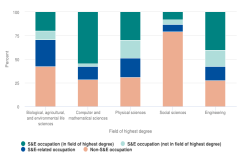
| 3-7 | Occupational distribution of S&E highest degree holders, by field of highest degree: 2015 | View Figure | Download PDF | Download XLSX | Download PNG |
| 3-8 | S&E degree holders working in S&E occupations, by level and field of S&E highest degree: 2015 | View Figure | Download PDF | Download XLSX | Download PNG |
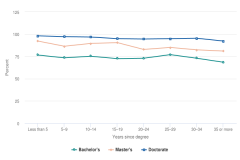
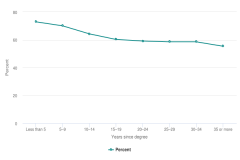
| 3-9 | S&E degree holders employed in jobs related to highest degree, by level of and years since highest degree: 2015 | View Figure | Download PDF | Download XLSX | Download PNG |
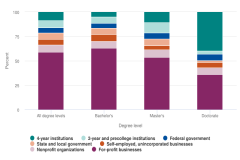
| 3-10 | S&E highest degree holders, by degree level and employment sector: 2015 | View Figure | Download PDF | Download XLSX | Download PNG |
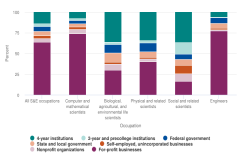
| 3-11 | Broad S&E occupational categories, by employment sector: 2015 | View Figure | Download PDF | Download XLSX | Download PNG |
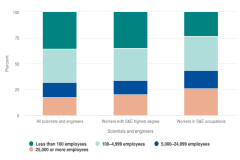
| 3-12 | Scientists and engineers employed in the business sector, by employer size: 2015 | View Figure | Download PDF | Download XLSX | Download PNG |
| 3-13 | Employed scientists and engineers with R&D activity, by broad field of highest degree and broad occupational category: 2015 | View Figure | Download PDF | Download XLSX | Download PNG |
| 3-14 | Employed SEH doctorate holders with R&D activity, by years since doctoral degree: 2015 | View Figure | Download PDF | Download XLSX | Download PNG |
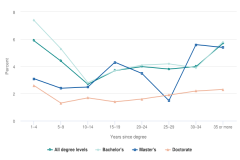
| 3-15 | Unemployment rates of S&E highest degree holders, by level of and years since highest degree: 2015 | View Figure | Download PDF | Download XLSX | Download PNG |
| 3-16 | Unemployment rate, by selected groups: 1990–2015 | View Figure | Download PDF | Download XLSX | Download PNG |
| 3-17 | S&E highest degree holders working involuntarily out of field, by field of and years since highest degree: 2015 | View Figure | Download PDF | Download XLSX | Download PNG |
| 3-18 | Median salaries for employed, college-educated individuals, by broad field of and years since highest degree: 2015 | View Figure | Download PDF | Download XLSX | Download PNG |
| 3-19 | Median salaries for S&E highest degree holders, by broad field of and years since highest degree: 2015 | View Figure | Download PDF | Download XLSX | Download PNG |
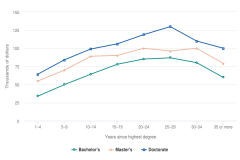
| 3-20 | Median salaries for S&E highest degree holders, by level of and years since highest degree: 2015 | View Figure | Download PDF | Download XLSX | Download PNG |
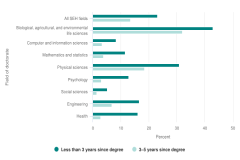
| 3-21 | Recent U.S. SEH doctorate recipients in postdoc positions, by field of and years since doctorate: 2015 | View Figure | Download PDF | Download XLSX | Download PNG |
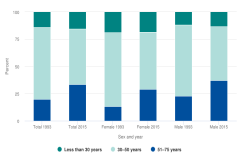
| 3-22 | Age distribution of scientists and engineers in the labor force, by sex: 1993 and 2015 | View Figure | Download PDF | Download XLSX | Download PNG |
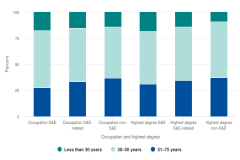
| 3-23 | Age distribution of employed scientists and engineers, by broad occupational category and broad field of highest degree: 2015 | View Figure | Download PDF | Download XLSX | Download PNG |
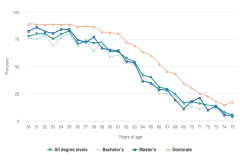
| 3-24 | Older scientists and engineers who work full time, by age and highest degree level: 2015 | View Figure | Download PDF | Download XLSX | Download PNG |
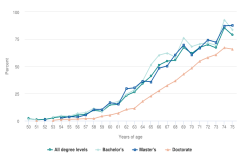
| 3-25 | Older scientists and engineers who report not working because of retirement, by age and highest degree level: 2015 | View Figure | Download PDF | Download XLSX | Download PNG |
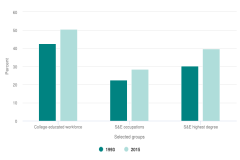
| 3-26 | Women in the workforce and in S&E: 1993 and 2015 | View Figure | Download PDF | Download XLSX | Download PNG |
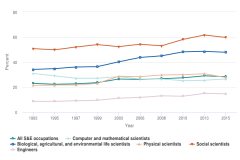
| 3-27 | Women in S&E occupations: 1993–2015 | View Figure | Download PDF | Download XLSX | Download PNG |
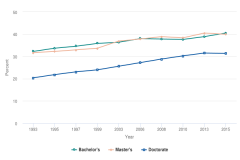
| 3-28 | Employed women with highest degree in S&E, by degree level: 1993–2015 | View Figure | Download PDF | Download XLSX | Download PNG |
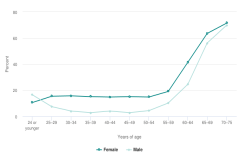
| 3-29 | Highest degree holders in S&E not in the labor force, by sex and age: 2015 | View Figure | Download PDF | Download XLSX | Download PNG |
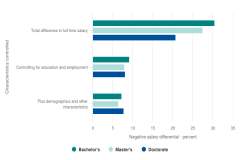
| 3-30 | Estimated salary differences between women and men with highest degree in S&E employed full time, controlling for selected characteristics, by degree level: 2015 | View Figure | Download PDF | Download XLSX | Download PNG |
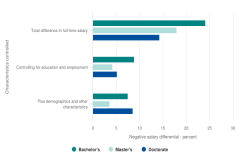
| 3-31 | Estimated salary differences between minorities and whites and Asians with highest degree in S&E employed full time, controlling for selected characteristics, by degree level: 2015 | View Figure | Download PDF | Download XLSX | Download PNG |
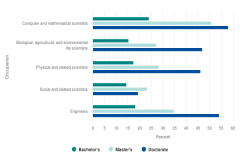
| 3-32 | Foreign-born scientists and engineers employed in S&E occupations, by highest degree level and broad S&E occupational category: 2015 | View Figure | Download PDF | Download XLSX | Download PNG |
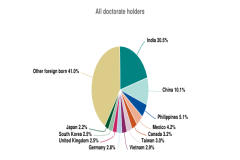
| 3-33 | Foreign-born individuals with highest degree in S&E living in the United States, by place of birth: 2015 | View Figure | Download PDF | Download XLSX | Download PNG |
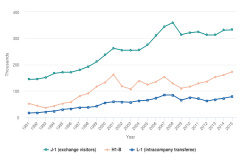
| 3-34 | Temporary work visas issued in categories with many high-skill workers: FYs 1991–2015 | View Figure | Download PDF | Download XLSX | Download PNG |
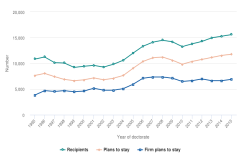
| 3-35 | Plans at graduation of foreign recipients of U.S. S&E doctoral degrees to stay in the United States, by year of doctorate: 1995–2015 | View Figure | Download PDF | Download XLSX | Download PNG |
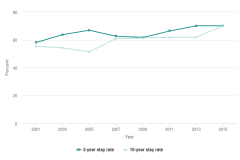
| 3-36 | Five-year and ten-year stay rates for U.S. S&E doctoral degree recipients with temporary visas at graduation: 2001–15 | View Figure | Download PDF | Download XLSX | Download PNG |
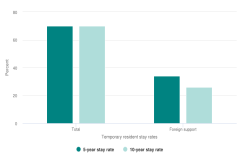
| 3-37 | Five-year and ten-year stay rates for temporary residents receiving S&E doctorates in 2005 and 2010, by foreign support: 2015 | View Figure | Download PDF | Download XLSX | Download PNG |
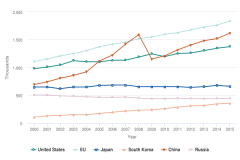
| 3-38 | Estimated number of researchers in selected regions or countries: 2000–15 | View Figure | Download PDF | Download XLSX | Download PNG |
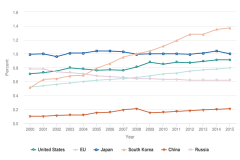
| 3-39 | Researchers as a share of total employment in selected regions or countries: 2000–15 | View Figure | Download PDF | Download XLSX | Download PNG |
| 3-40 | Gross domestic expenditures on R&D (GERD) per researcher in selected regions or countries: 2000–15 | View Figure | Download PDF | Download XLSX | Download PNG |
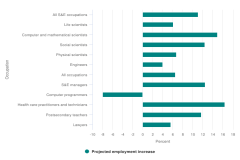
| 3-A | Projected increases in employment for S&E and other selected occupations: 2014–24 | View Figure | Download PDF | Download XLSX | Download PNG |
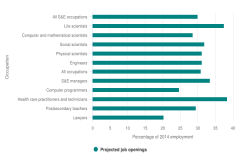
| 3-B | Projected job openings in S&E and other selected occupations: 2014–24 | View Figure | Download PDF | Download XLSX | Download PNG |
Chapter 4. Research and Development: U.S. Trends and International Comparisons
| FIGURE | TITLE | VIEW | EXCEL | PNG | |
|---|---|---|---|---|---|
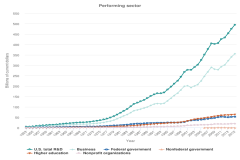
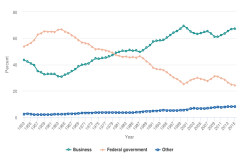
| 4-1 | U.S. R&D, by performing sector and source of funds: 1953–2015 | View Figure | Download PDF | Download XLSX | Download PNG |
| 4-2 | Year-to-year changes in U.S. R&D expenditures, by performing sector: 2010–15 | View Figure | Download PDF | Download XLSX | Download PNG |
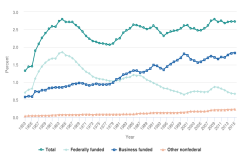
| 4-3 | Ratio of U.S. R&D to gross domestic product, by roles of federal, business, and other nonfederal funding for R&D: 1953–2015 | View Figure | Download PDF | Download XLSX | Download PNG |
| 4-4 | U.S. total R&D expenditures, by source of funds: 1953–2015 | View Figure | Download PDF | Download XLSX | Download PNG |
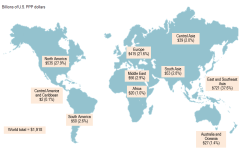
| 4-5 | Global R&D expenditures, by region: 2015 | View Figure | Download PDF | Download XLSX | Download PNG |
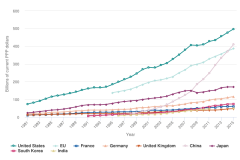
| 4-6 | Gross domestic expenditures on R&D, by the United States, the EU, and selected other countries: 1981–2015 | View Figure | Download PDF | Download XLSX | Download PNG |
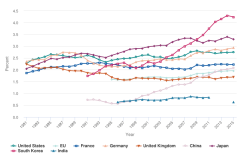
| 4-7 | Gross domestic expenditures on R&D as a share of gross domestic product, by the United States, the EU, and selected other countries: 1981–2015 | View Figure | Download PDF | Download XLSX | Download PNG |
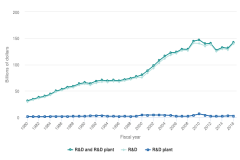
| 4-8 | Federal obligations for R&D and R&D plant: FYs 1980–2016 | View Figure | Download PDF | Download XLSX | Download PNG |
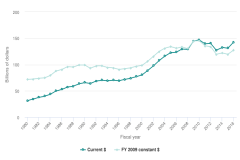
| 4-9 | Federal obligations for R&D and R&D plant, current versus constant dollars: FYs 1980–2016 | View Figure | Download PDF | Download XLSX | Download PNG |
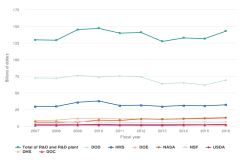
| 4-10 | Federal obligations for R&D and R&D plant, by selected agencies: FYs 2007–16 | View Figure | Download PDF | Download XLSX | Download PNG |
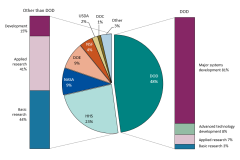
| 4-11 | Federal obligations for R&D, by agency and type of work: FY 2015 | View Figure | Download PDF | Download XLSX | Download PNG |
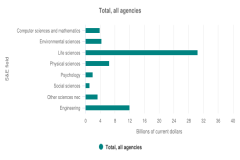
| 4-12 | Federal obligations for research, by agency and major S&E field: FY 2015 | View Figure | Download PDF | Download XLSX | Download PNG |
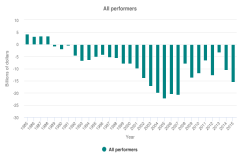
| 4-A | Difference in federal R&D support, as reported by performers and federal agencies: 1985–2015 | View Figure | Download PDF | Download XLSX | Download PNG |
Chapter 5. Academic Research and Development
| FIGURE | TITLE | VIEW | EXCEL | PNG | |
|---|---|---|---|---|---|
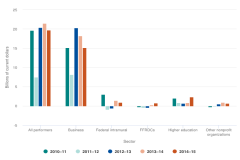
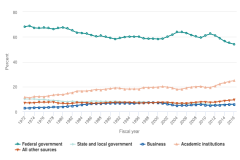
| 5-1 | Academic R&D expenditures, by source of funding: FYs 1972–2016 | View Figure | Download PDF | Download XLSX | Download PNG |
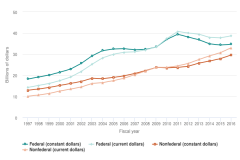
| 5-2 | Federal and nonfederal funding of academic R&D expenditures: FYs 1997–2016 | View Figure | Download PDF | Download XLSX | Download PNG |
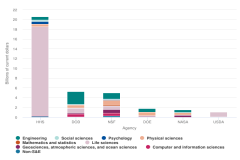
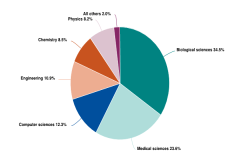
| 5-3 | Federally financed academic R&D expenditures, by agency and S&E field: FY 2016 | View Figure | Download PDF | Download XLSX | Download PNG |
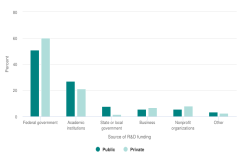
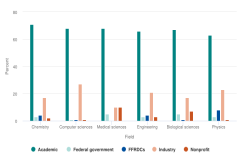
| 5-4 | Sources of R&D funding for public and private academic institutions: FY 2016 | View Figure | Download PDF | Download XLSX | Download PNG |
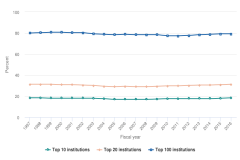
| 5-5 | Share of academic R&D, by institution rank in R&D expenditures: FYs 1997–2016 | View Figure | Download PDF | Download XLSX | Download PNG |
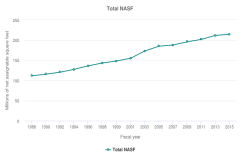
| 5-6 | Change in S&E research space in academic institutions, by 2-year period: FYs 1988–2015 | View Figure | Download PDF | Download XLSX | Download PNG |
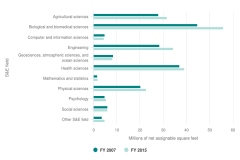
| 5-7 | Research space at academic institutions, by S&E field: FYs 2007 and 2015 | View Figure | Download PDF | Download XLSX | Download PNG |
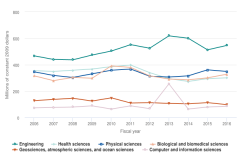
| 5-8 | Current fund expenditures for S&E research equipment at academic institutions, by selected S&E field: FYs 2006–16 | View Figure | Download PDF | Download XLSX | Download PNG |
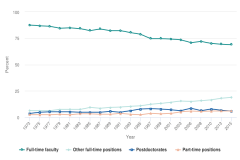
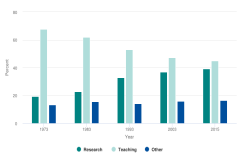
| 5-9 | S&E doctorate holders employed in academia, by type of position: 1973–2015 | View Figure | Download PDF | Download XLSX | Download PNG |
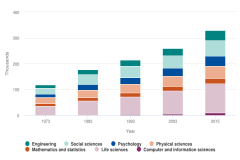
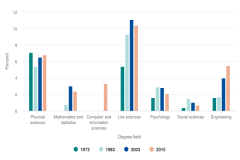
| 5-10 | S&E doctorate holders employed in academia, by field: Selected years, 1973–2015 | View Figure | Download PDF | Download XLSX | Download PNG |
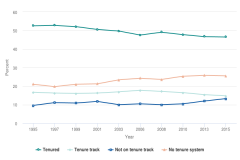
| 5-11 | Tenure status of S&E doctorate holders employed in academia: 1995–2015 | View Figure | Download PDF | Download XLSX | Download PNG |
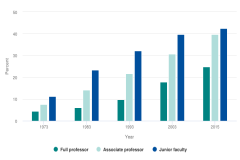
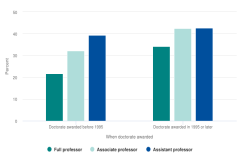
| 5-12 | Women as a percentage of S&E doctorate holders employed full time in academia, by academic rank: Selected years, 1973–2015 | View Figure | Download PDF | Download XLSX | Download PNG |
| 5-13 | Women as a percentage of younger and older S&E doctorate holders employed full time in academia, by academic rank: 2015 | View Figure | Download PDF | Download XLSX | Download PNG |
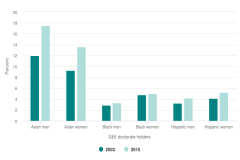
| 5-14 | Black, Hispanic, and Asian S&E doctorate holders employed in academia as a percentage of full-time faculty positions, by sex: 2003 and 2015 | View Figure | Download PDF | Download XLSX | Download PNG |
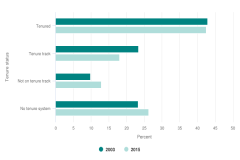
| 5-15 | Tenure status of underrepresented minority S&E doctorate holders employed in academia: 2003 and 2015 | View Figure | Download PDF | Download XLSX | Download PNG |
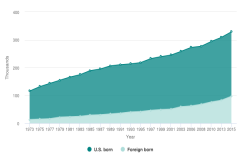
| 5-16 | U.S.-trained S&E doctorate holders employed in academia, by birthplace: 1973–2015 | View Figure | Download PDF | Download XLSX | Download PNG |
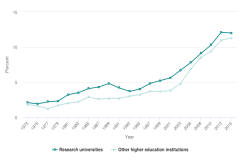
| 5-17 | Full-time faculty ages 65–75 at research universities and other higher education institutions: 1973–2015 | View Figure | Download PDF | Download XLSX | Download PNG |
| 5-18 | Primary work activity of full-time doctoral S&E faculty: Selected years, 1973–2015 | View Figure | Download PDF | Download XLSX | Download PNG |
| 5-19 | S&E doctorate holders employed in academia in a postdoctoral position, by S&E degree field: Selected years, 1973–2015 | View Figure | Download PDF | Download XLSX | Download PNG |
| 5-20 | S&E doctorate holders employed in very high research activity institutions with federal research support, by sex, race, and ethnicity: 2015 | View Figure | Download PDF | Download XLSX | Download PNG |
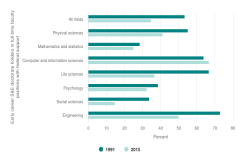
| 5-21 | Early career S&E doctorate holders employed in full-time faculty positions with federal support, by field: 1991 and 2015 | View Figure | Download PDF | Download XLSX | Download PNG |
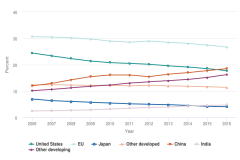
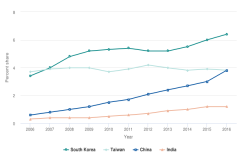
| 5-22 | S&E articles, by global share of selected region, country, or economy: 2006–16 | View Figure | Download PDF | Download XLSX | Download PNG |
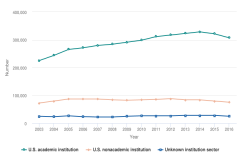
| 5-23 | U.S. academic and nonacademic S&E articles: 2003–16 | View Figure | Download PDF | Download XLSX | Download PNG |
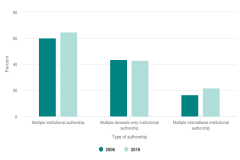
| 5-24 | Share of world articles in all fields with authors from multiple institutions, domestic-only institutions, and international coauthorship: 2006 and 2016 | View Figure | Download PDF | Download XLSX | Download PNG |
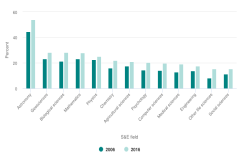
| 5-25 | Share of world S&E articles with international collaboration, by S&E field: 2006 and 2016 | View Figure | Download PDF | Download XLSX | Download PNG |
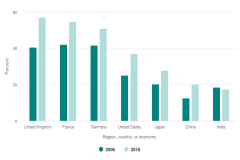
| 5-26 | Share of S&E articles internationally coauthored, by selected region, country, or economy: 2006 and 2016 | View Figure | Download PDF | Download XLSX | Download PNG |
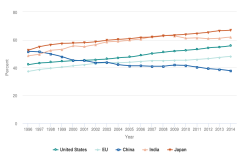
| 5-27 | Share of citations to selected region, country, or economy that are received from authors abroad: 1996–2014 | View Figure | Download PDF | Download XLSX | Download PNG |
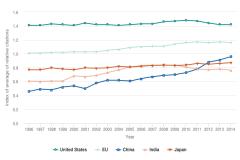
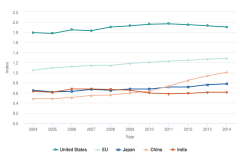
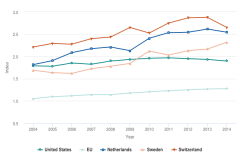
| 5-28 | Average relative citations, by region, country, or economy: 1996–2014 | View Figure | Download PDF | Download XLSX | Download PNG |
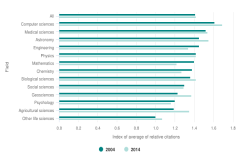
| 5-29 | Average relative citations for the United States, by S&E field: 2004 and 2014 | View Figure | Download PDF | Download XLSX | Download PNG |
| 5-30 | Share of S&E publications in the top 1% of most cited publications, by selected region, country, or economy: 2004–14 | View Figure | Download PDF | Download XLSX | Download PNG |
| 5-31 | S&E publication output in the top 1% of cited publications, by selected region, country, or economy: 2004–14 | View Figure | Download PDF | Download XLSX | Download PNG |
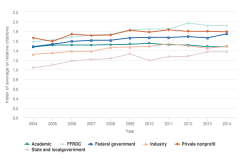
| 5-32 | Average relative citations for U.S. S&E articles, by sector: 2004–14 | View Figure | Download PDF | Download XLSX | Download PNG |
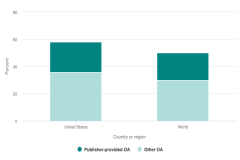
| 5-A | Share of publications available in publisher-provided open access and total open access: 2006–15 | View Figure | Download PDF | Download XLSX | Download PNG |
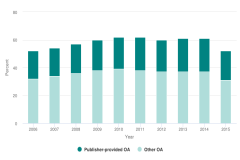
| 5-B | Annual percentage of U.S. publications available in publisher-provided open access and total open access: 2006–15 | View Figure | Download PDF | Download XLSX | Download PNG |
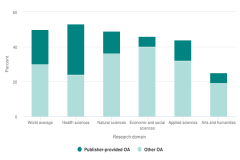
| 5-C | Percentage of publications available in publisher-provided open access and total open access, by research domain: 2006–15 | View Figure | Download PDF | Download XLSX | Download PNG |
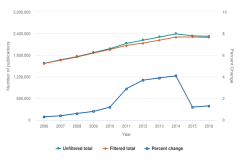
| 5-D | Filtered and unfiltered publications in Scopus, by year: 2006–16 | View Figure | Download PDF | Download XLSX | Download PNG |
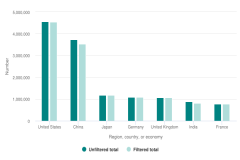
| 5-E | Filtered and unfiltered publications in Scopus, by region, country, or economy: 2006–16 | View Figure | Download PDF | Download XLSX | Download PNG |
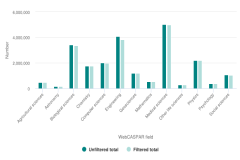
| 5-F | Filtered and unfiltered publications in Scopus, by WebCASPAR field: 2006–16 | View Figure | Download PDF | Download XLSX | Download PNG |
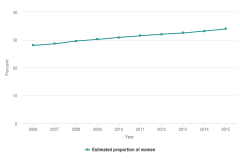
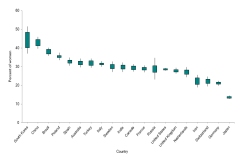
| 5-G | Trends in the proportion of female authors of S&E publications in Scopus: 2006–15 | View Figure | Download PDF | Download XLSX | Download PNG |
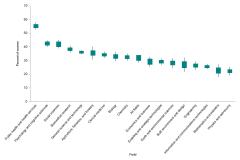
| 5-H | Proportion of female authors of S&E publications, by field: 2006–15 | View Figure | Download PDF | Download XLSX | Download PNG |
| 5-I | Proportion of female authors of S&E publications, by country: 2006–15 | View Figure | Download PDF | Download XLSX | Download PNG |
Chapter 6. Industry, Technology, and the Global Marketplace
| FIGURE | TITLE | VIEW | EXCEL | PNG | |
|---|---|---|---|---|---|
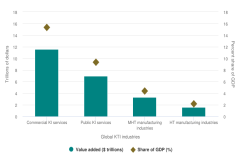
| 6-1 | Global KTI industries, by output and share of GDP: 2016 | View Figure | Download PDF | Download XLSX | Download PNG |
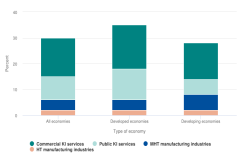
| 6-2 | Selected industry category share of GDP of developed and developing economies: 2016 | View Figure | Download PDF | Download XLSX | Download PNG |
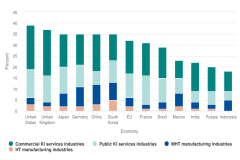
| 6-3 | Output of KTI industries as a share of the GDP of selected countries or economies: 2016 | View Figure | Download PDF | Download XLSX | Download PNG |
| 6-4 | ICT business spending as a share of selected industry categories for selected countries or economies: 2016 | View Figure | Download PDF | Download XLSX | Download PNG |
| 6-5 | Output of education and health care for selected regions, countries, or economies: 2003–16 | View Figure | Download PDF | Download XLSX | Download PNG |
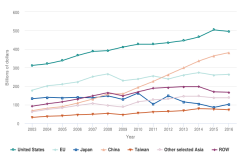
| 6-6 | Output of commercial KI services for selected regions, countries, or economies: 2003–16 | View Figure | Download PDF | Download XLSX | Download PNG |
| 6-7 | U.S. employment in commercial KI services: 2006–16 | View Figure | Download PDF | Download XLSX | Download PNG |
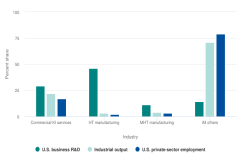
| 6-8 | U.S. KTI industry share of U.S. business R&D spending, industry output, and industry employment: 2014 | View Figure | Download PDF | Download XLSX | Download PNG |
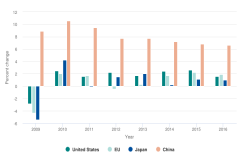
| 6-9 | Growth in real GDP, by selected region, country, or economy: 2009–16 | View Figure | Download PDF | Download XLSX | Download PNG |
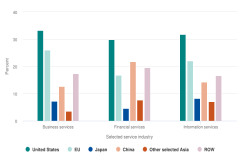
| 6-10 | Global value-added shares of selected service industries for selected regions, countries, or economies: 2016 | View Figure | Download PDF | Download XLSX | Download PNG |
| 6-11 | Output of HT manufacturing industries for selected regions, countries, or economies: 2003–16 | View Figure | Download PDF | Download XLSX | Download PNG |
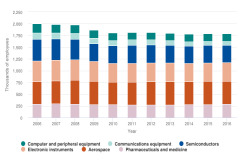
| 6-12 | U.S. employment in HT manufacturing industries: 2006–16 | View Figure | Download PDF | Download XLSX | Download PNG |
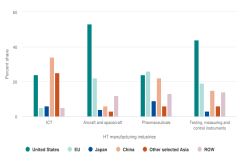
| 6-13 | HT manufacturing industries of selected regions, countries, or economies: 2016 | View Figure | Download PDF | Download XLSX | Download PNG |
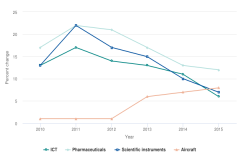
| 6-14 | Annual change in value-added output of selected manufacturing industries in China: 2010–15 | View Figure | Download PDF | Download XLSX | Download PNG |
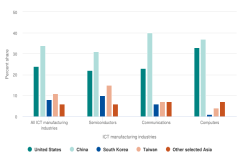
| 6-15 | Global share of selected regions, countries, or economies in ICT manufacturing industries: 2016 | View Figure | Download PDF | Download XLSX | Download PNG |
| 6-16 | Output of MHT manufacturing industries for selected regions, countries, or economies: 2003–16 | View Figure | Download PDF | Download XLSX | Download PNG |
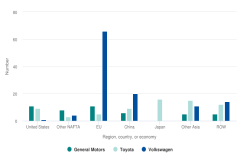
| 6-17 | Manufacturing facilities of General Motors, Toyota, and Volkswagen, by selected region, country, or economy: 2016 | View Figure | Download PDF | Download XLSX | Download PNG |
| 6-18 | Output of motor vehicles and parts industry for selected regions, countries, or economies: 2003–16 | View Figure | Download PDF | Download XLSX | Download PNG |
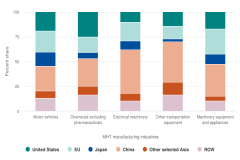
| 6-19 | Global share of selected regions, countries, or economies of MHT manufacturing industries: 2016 | View Figure | Download PDF | Download XLSX | Download PNG |
| 6-20 | U.S. employment in MHT manufacturing industries: 2006–16 | View Figure | Download PDF | Download XLSX | Download PNG |
| 6-21 | Global exports of commercial KTI products and services: 2008–16 | View Figure | Download PDF | Download XLSX | Download PNG |
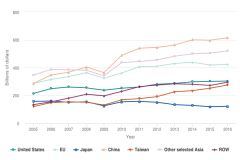
| 6-22 | Commercial KI service exports, by selected region, country, or economy: 2008–16 | View Figure | Download PDF | Download XLSX | Download PNG |
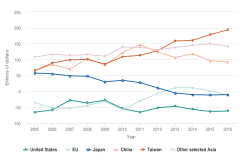
| 6-23 | Trade balance of commercial KI services, by selected region, country, or economy: 2008–16 | View Figure | Download PDF | Download XLSX | Download PNG |
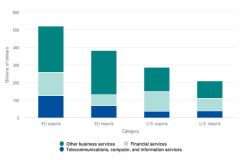
| 6-24 | U.S. and EU commercial KI services trade, by category: 2016 | View Figure | Download PDF | Download XLSX | Download PNG |
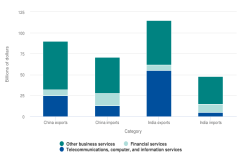
| 6-25 | China's and India's trade in commercial KI services, by category: 2016 | View Figure | Download PDF | Download XLSX | Download PNG |
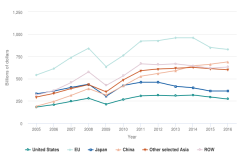
| 6-26 | Exports of HT products, by selected region, country, or economy: 2005–16 | View Figure | Download PDF | Download XLSX | Download PNG |
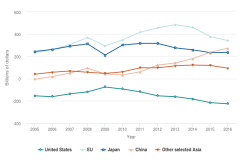
| 6-27 | Trade balance of HT products, by selected region, country, or economy: 2005–16 | View Figure | Download PDF | Download XLSX | Download PNG |
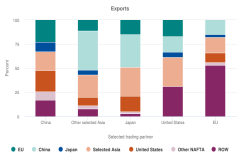
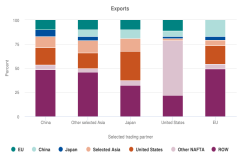
| 6-28 | Trade in ICT products of selected regions, countries, or economies, by selected trading partner: 2016 | View Figure | Download PDF | Download XLSX | Download PNG |
| 6-29 | Exports of MHT products, by selected region, country, or economy: 2005–16 | View Figure | Download PDF | Download XLSX | Download PNG |
| 6-30 | Trade balance of MHT products, by selected region, country, or economy: 2005–16 | View Figure | Download PDF | Download XLSX | Download PNG |
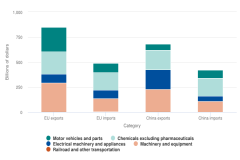
| 6-31 | China and EU MHT trade, by product: 2016 | View Figure | Download PDF | Download XLSX | Download PNG |
| 6-32 | Trade in motor vehicles and parts of selected regions, countries, or economies, by selected trading partner: 2016 | View Figure | Download PDF | Download XLSX | Download PNG |
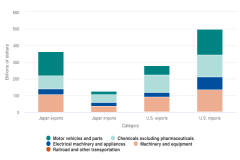
| 6-33 | Japan and United States trade in MHT products, by product: 2016 | View Figure | Download PDF | Download XLSX | Download PNG |
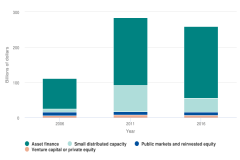
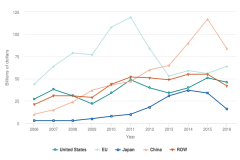
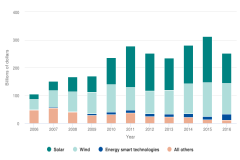
| 6-34 | Private investment in sustainable energy technologies, by type of financing: 2006, 2010, and 2016 | View Figure | Download PDF | Download XLSX | Download PNG |
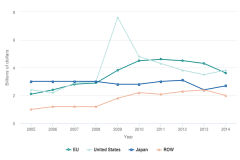
| 6-35 | Government RD&D expenditures on sustainable energy technologies, by selected region, country, or economy: 2005–14 | View Figure | Download PDF | Download XLSX | Download PNG |
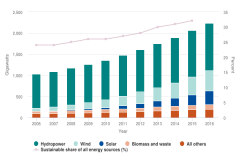
| 6-36 | Global generation capacity of sustainable energy, by source: 2006–16 | View Figure | Download PDF | Download XLSX | Download PNG |
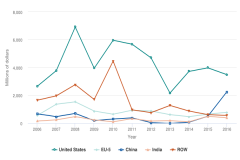
| 6-37 | Global venture capital and private equity investment in sustainable energy technologies, by selected region or country: 2006–16 | View Figure | Download PDF | Download XLSX | Download PNG |
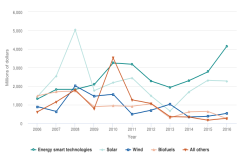
| 6-38 | Global venture capital and private equity investment in sustainable energy technologies, by selected technology: 2006–16 | View Figure | Download PDF | Download XLSX | Download PNG |
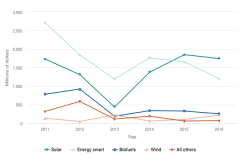
| 6-39 | U.S. venture capital and private equity investment in sustainable energy technologies, by selected technology: 2011–16 | View Figure | Download PDF | Download XLSX | Download PNG |
| 6-40 | Later-stage private investment in sustainable energy technologies, by selected region or country: 2006–16 | View Figure | Download PDF | Download XLSX | Download PNG |
| 6-41 | Later-stage private investment in sustainable energy technologies, by selected technology: 2006–16 | View Figure | Download PDF | Download XLSX | Download PNG |
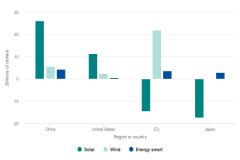
| 6-42 | Cumulative change in later-stage sustainable energy technologies private investment, by selected region or country and technology area: 2013–16 | View Figure | Download PDF | Download XLSX | Download PNG |
| 6-43 | Generation capacity in solar and wind by selected region or country: 2006–16 | View Figure | Download PDF | Download XLSX | Download PNG |
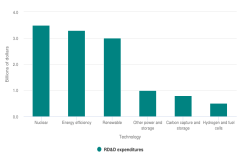
| 6-44 | Government RD&D expenditures on sustainable energy technologies, by technology: 2014 | View Figure | Download PDF | Download XLSX | Download PNG |
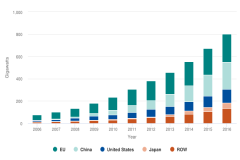
| 6-45 | USPTO patents in sustainable energy technologies, by selected region, country, or economy of inventor: 2006–16 | View Figure | Download PDF | Download XLSX | Download PNG |
| 6-46 | USPTO patents in sustainable energy technologies, by selected region, country, or economy of inventor: 2006–16 | View Figure | Download PDF | Download XLSX | Download PNG |
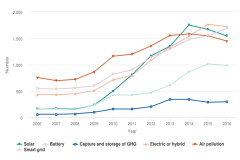
| 6-47 | USPTO patents in sustainable energy technologies, by selected technology: 2006–16 | View Figure | Download PDF | Download XLSX | Download PNG |
| 6-48 | Patent activity index of selected sustainable energy technologies for the United States, the EU, Japan, and South Korea: 2014–16 | View Figure | Download PDF | Download XLSX | Download PNG |
| 6-A | Growth in output of selected categories of industries, by selected country or economy: 2011–16 | View Figure | Download PDF | Download XLSX | Download PNG |
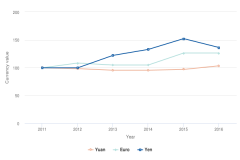
| 6-B | U.S. dollar exchange rate with selected currencies: 2011–16 | View Figure | Download PDF | Download XLSX | Download PNG |
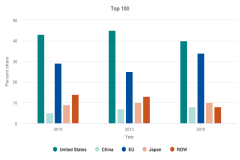
| 6-C | Top-ranked supercomputers, by location of region, country, or economy: 2010–16 | View Figure | Download PDF | Download XLSX | Download PNG |
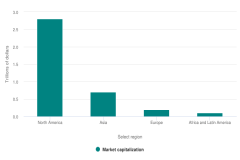
| 6-D | Headquarters of platform companies, by selected region: 2015 | View Figure | Download PDF | Download XLSX | Download PNG |
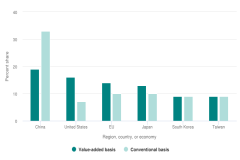
| 6-E | Exports of computer, electrical, and optical equipment, by selected region, country, or economy on conventional and value-added basis: 2011 | View Figure | Download PDF | Download XLSX | Download PNG |
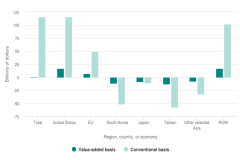
| 6-F | China's trade balance in the electrical and optical equipment industry, by selected region, country, or economy on conventional and value-added basis: 2011 | View Figure | Download PDF | Download XLSX | Download PNG |
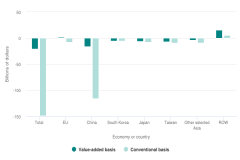
| 6-G | U.S. trade balance in the electrical and optical equipment industry, by selected country or economy on conventional and value-added basis: 2011 | View Figure | Download PDF | Download XLSX | Download PNG |
Chapter 7. Science and Technology: Public Attitudes and Understanding
| FIGURE | TITLE | VIEW | EXCEL | PNG | |
|---|---|---|---|---|---|
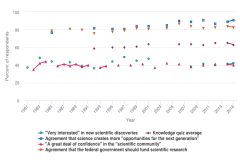
| 7-1 | Key science and engineering knowledge and attitude indicators: 1981–2016 | View Figure | Download PDF | Download XLSX | Download PNG |
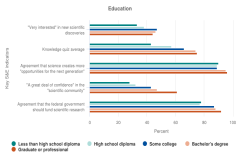
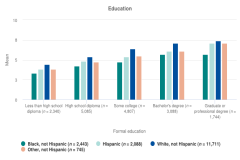
| 7-2 | Key science and engineering indicators, by selected respondent education, sex, and age: 2016 | View Figure | Download PDF | Download XLSX | Download PNG |
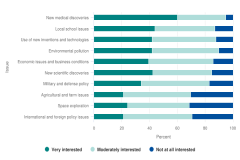
| 7-3 | Public interest in selected issues: 2016 | View Figure | Download PDF | Download XLSX | Download PNG |
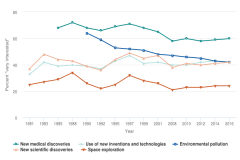
| 7-4 | Public interest in selected science-related issues: 1981–2016 | View Figure | Download PDF | Download XLSX | Download PNG |
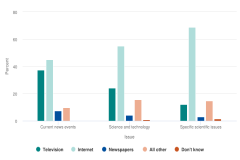
| 7-5 | Primary source respondents used to learn about current news events, science and technology, and specific scientific issues: 2016 | View Figure | Download PDF | Download XLSX | Download PNG |
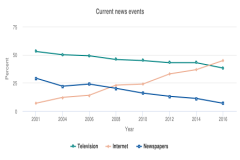
| 7-6 | Primary source respondents used to learn about current news events, science and technology, and specific scientific issues: 2001–16 | View Figure | Download PDF | Download XLSX | Download PNG |
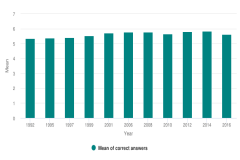
| 7-7 | Mean number of correct answers to trend factual knowledge of science scale: 1992–2016 | View Figure | Download PDF | Download XLSX | Download PNG |
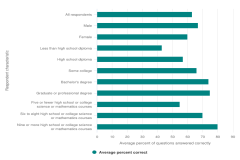
| 7-8 | Correct answers to trend factual knowledge of science scale, by respondent characteristic: 2016 | View Figure | Download PDF | Download XLSX | Download PNG |
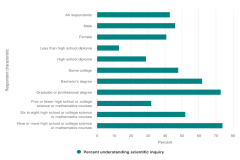
| 7-9 | Understanding scientific inquiry, by respondent characteristic: 2016 | View Figure | Download PDF | Download XLSX | Download PNG |
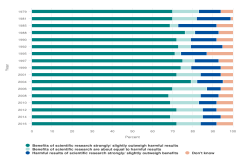
| 7-10 | Public assessment of scientific research: 1979–2016 | View Figure | Download PDF | Download XLSX | Download PNG |
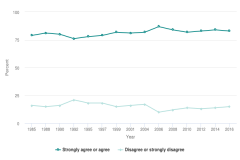
| 7-11 | Public opinion on whether government should fund basic scientific research: 1985–2016 | View Figure | Download PDF | Download XLSX | Download PNG |
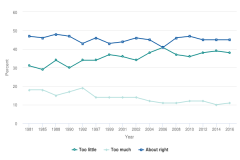
| 7-12 | Public assessment of amount of spending for scientific research: 1981–2016 | View Figure | Download PDF | Download XLSX | Download PNG |
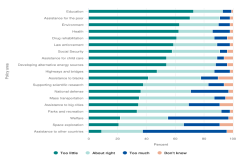
| 7-13 | Public attitudes toward spending in various policy areas: 2016 | View Figure | Download PDF | Download XLSX | Download PNG |
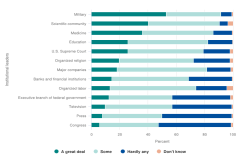
| 7-14 | Public confidence in institutional leaders, by type of institution: 2016 | View Figure | Download PDF | Download XLSX | Download PNG |
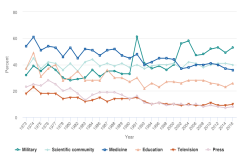
| 7-15 | Public confidence in institutional leaders, by selected institution: 1973–2016 | View Figure | Download PDF | Download XLSX | Download PNG |
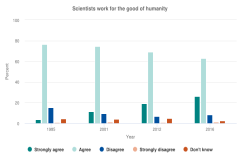
| 7-16 | Public views about scientists: Selected years, 1983–2016 | View Figure | Download PDF | Download XLSX | Download PNG |
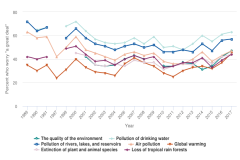
| 7-17 | Concern about specific environmental issues: 1989–2017 | View Figure | Download PDF | Download XLSX | Download PNG |
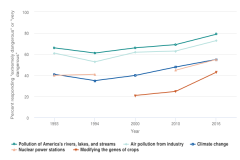
| 7-18 | Perceived danger of specific health and environmental issues: Selected years, 1993–2016 | View Figure | Download PDF | Download XLSX | Download PNG |
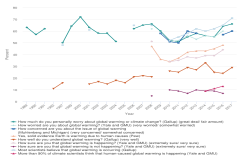
| 7-19 | Belief in global warming and confidence in that belief: 1989–2017 | View Figure | Download PDF | Download XLSX | Download PNG |
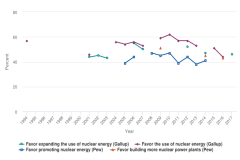
| 7-20 | Views on nuclear energy: 1994–2017 | View Figure | Download PDF | Download XLSX | Download PNG |
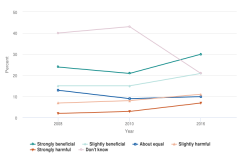
| 7-21 | Views on nanotechnology: 2008, 2010, 2016 | View Figure | Download PDF | Download XLSX | Download PNG |
| 7-A | Correct answers to factual knowledge questions, by respondent characteristic: 2006–16 (combined) | View Figure | Download PDF | Download XLSX | Download PNG |
Chapter 8. Invention, Knowledge Transfer, and Innovation
| FIGURE | TITLE | VIEW | EXCEL | PNG | |
|---|---|---|---|---|---|
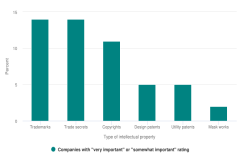
| 8-1 | For companies that performed or funded R&D, shares rating intellectual property as being very or somewhat important: 2011 | View Figure | Download PDF | Download XLSX | Download PNG |
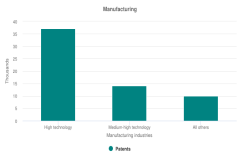
| 8-2 | USPTO patents granted, by selected U.S. industry: 2015 | View Figure | Download PDF | Download XLSX | Download PNG |
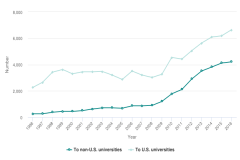
| 8-3 | USPTO patents granted to U.S. and non-U.S. academic institutions: 1996–2016 | View Figure | Download PDF | Download XLSX | Download PNG |
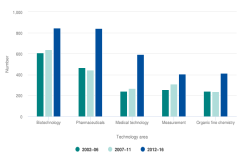
| 8-4 | U.S. academic patents, by selected technology area, 5-year averages: 2002–16 | View Figure | Download PDF | Download XLSX | Download PNG |
| 8-5 | USPTO patents granted, by selected region, country, or economy of inventor: 2006–16 | View Figure | Download PDF | Download XLSX | Download PNG |
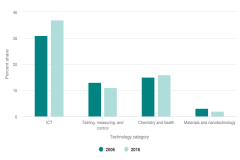
| 8-6 | USPTO patents granted in selected broad technology categories: 2006 and 2016 | View Figure | Download PDF | Download XLSX | Download PNG |
| 8-7 | USPTO patents granted, by selected country or economy of inventor: 2006–16 | View Figure | Download PDF | Download XLSX | Download PNG |
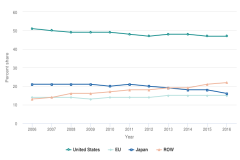
| 8-8 | Patent activity index for selected technologies for the United States, the EU, and Japan: 2014–16 | View Figure | Download PDF | Download XLSX | Download PNG |
| 8-9 | Patent activity index of selected technologies for South Korea, Taiwan, and China: 2014–16 | View Figure | Download PDF | Download XLSX | Download PNG |
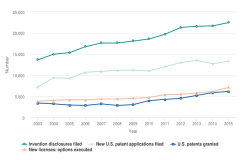
| 8-10 | U.S. university patenting activities: 2003–15 | View Figure | Download PDF | Download XLSX | Download PNG |
| 8-11 | Citations of U.S. S&E articles in U.S. patents, by selected S&E article field: 2016 | View Figure | Download PDF | Download XLSX | Download PNG |
| 8-12 | Citation of U.S. S&E articles in USPTO patents, by selected S&E field and article author sector: 2016 | View Figure | Download PDF | Download XLSX | Download PNG |
| 8-13 | Exports of intellectual property (charges for their use), by selected region, country, or economy: 2008–16 | View Figure | Download PDF | Download XLSX | Download PNG |
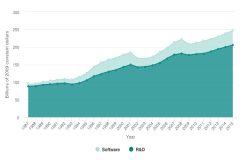
| 8-14 | Private investment in intangibles, by type, for the manufacturing sector: 1987–2015 | View Figure | Download PDF | Download XLSX | Download PNG |
| 8-15 | Private investment in intangibles, by type, for the nonmanufacturing sector: 1987–2015 | View Figure | Download PDF | Download XLSX | Download PNG |
| 8-16 | Global venture capital investment, by financing stage: 2006–16 | View Figure | Download PDF | Download XLSX | Download PNG |
| 8-17 | Seed-stage venture capital investment, by selected country or economy: 2006–16 | View Figure | Download PDF | Download XLSX | Download PNG |
| 8-18 | Global seed-stage venture capital investment: 2006–16 | View Figure | Download PDF | Download XLSX | Download PNG |
| 8-19 | U.S. seed-stage venture capital investment, by selected industry: 2011–16 | View Figure | Download PDF | Download XLSX | Download PNG |
| 8-20 | U.S. seed-stage venture capital investment, by selected industry: 2013 and 2016 | View Figure | Download PDF | Download XLSX | Download PNG |
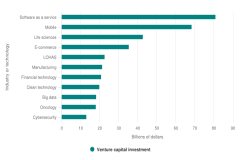
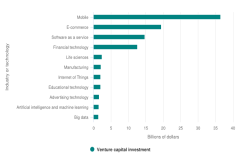
| 8-21 | U.S. early- and later-stage venture capital investment, by selected industry: 2013 and 2016 | View Figure | Download PDF | Download XLSX | Download PNG |
| 8-22 | Early- and later-stage venture capital investment, by selected country or economy: 2006–16 | View Figure | Download PDF | Download XLSX | Download PNG |
| 8-23 | Early- and later-stage venture capital investment, by selected country: 2006–16 | View Figure | Download PDF | Download XLSX | Download PNG |
| 8-24 | U.S. early- and later-stage venture capital investment, by selected industry: 2011–16 | View Figure | Download PDF | Download XLSX | Download PNG |
| 8-25 | China early- and later-stage venture capital investment, by selected industry: 2011–16 | View Figure | Download PDF | Download XLSX | Download PNG |
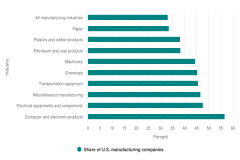
| 8-26 | Share of U.S. manufacturing companies reporting product or process innovation, by selected industry: 2013–15 | View Figure | Download PDF | Download XLSX | Download PNG |
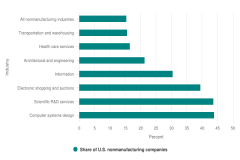
| 8-27 | Share of U.S. nonmanufacturing companies reporting product or process innovation, by selected industry: 2013–15 | View Figure | Download PDF | Download XLSX | Download PNG |
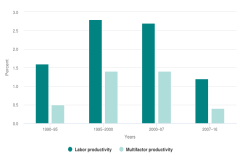
| 8-28 | Labor and multifactor productivity annual growth, multiyear averages, private nonfarm business sector: 1990–2016 | View Figure | Download PDF | Download XLSX | Download PNG |
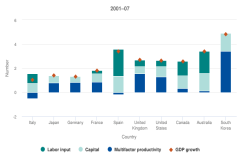
| 8-29 | Contributions to GDP growth, average: 2001–07 and 2009–15, selected OECD countries | View Figure | Download PDF | Download XLSX | Download PNG |
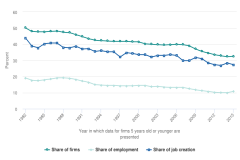
| 8-30 | Share of firms, job creation, and employment from firms 5 years old or younger: 1982–2015 | View Figure | Download PDF | Download XLSX | Download PNG |

